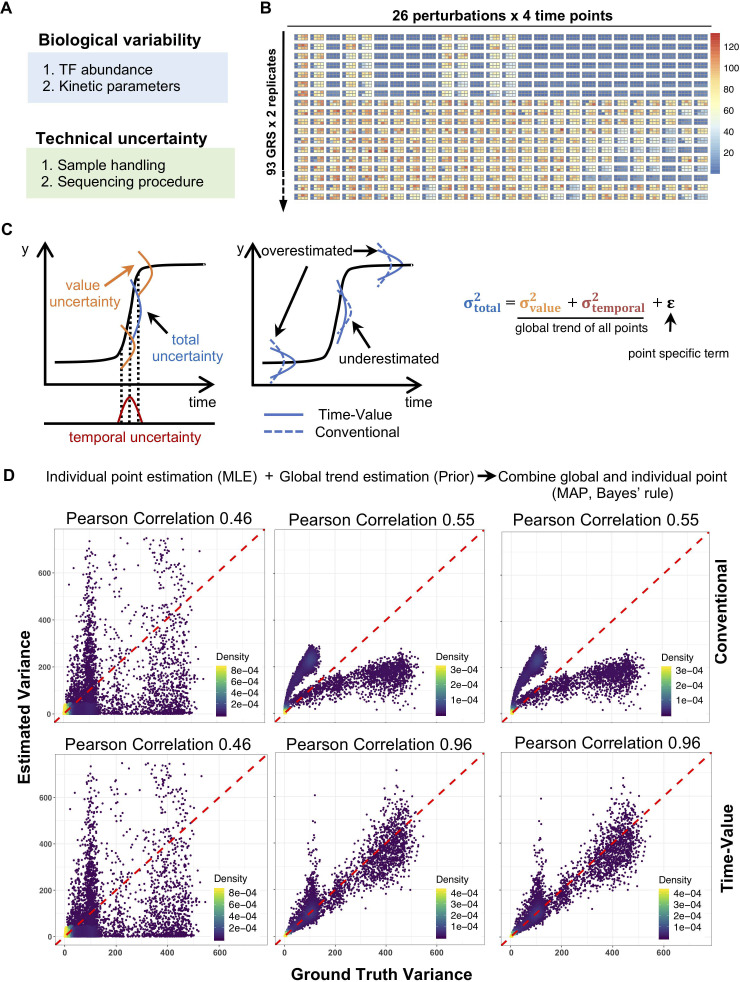
Fig 3. An error model for stimulus-response data that leverages timecourse information to avoid under and over-estimates of measurement uncertainty.
(A) Uncertainty sources in data simulation. We considered both biological variability and technical uncertainty. (B) Simulated gene expression data with uncertainty (see Methods). Replicate datasets for 18 of the 93 GRSs are shown here. (C) Diagram of the time-value error model. Left panel shows how observed uncertainty can be decomposed into value and temporal uncertainties. Middle panel shows how the conventional model will under- and over-estimate data uncertainty. Right panel shows that error is decomposed into value uncertainty, temporal uncertainty, and point-specific uncertainty. (D) Uncertainty estimation with the temporal-value and conventional error model. For the left column, we estimated data uncertainty from each point using Maximum Likelihood Estimation (MLE) (98% points are shown). For the middle column, we estimated the global trend as prior. By applying Bayes’ rule, we obtained posterior estimates, right column. Pearson correlations are calculated between estimated variance and ground truth variance. Top row corresponds to the conventional model, and bottom row to our error model.

