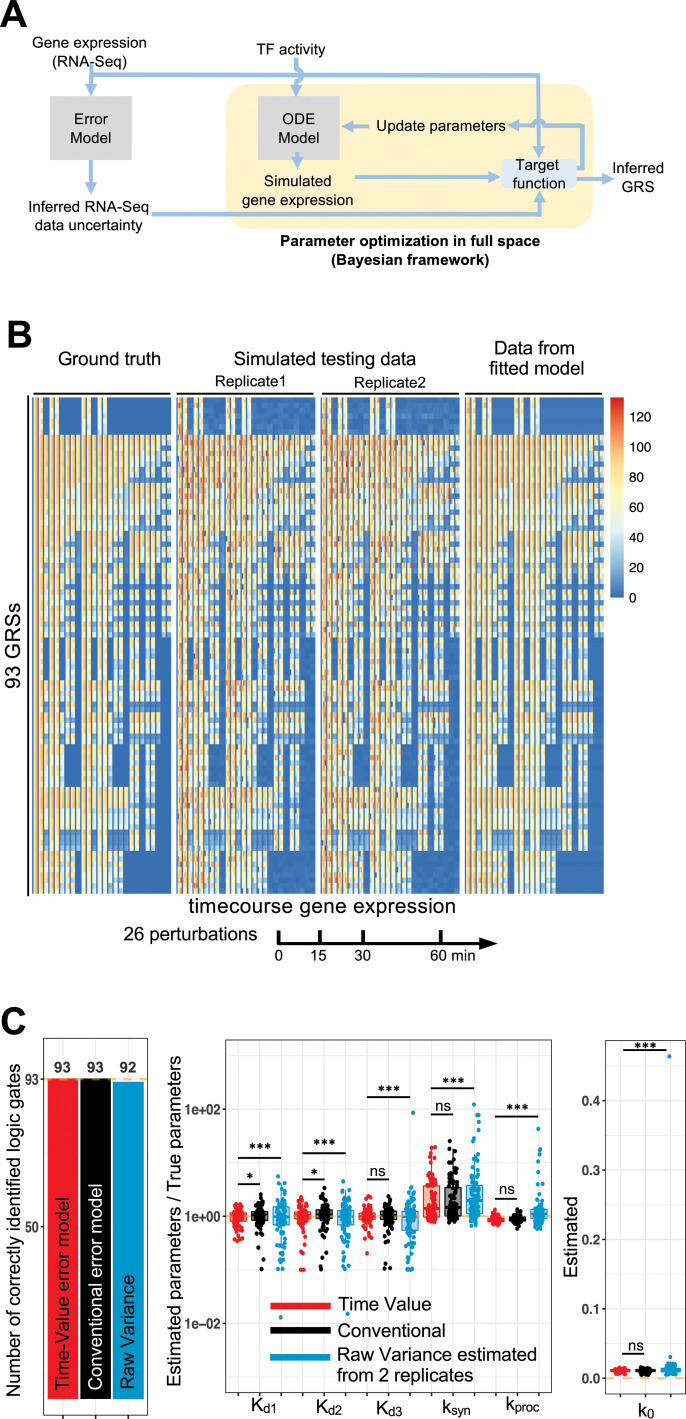
Fig 4. Bayesian framework to parameterize model with data uncertainty.
(A) Diagram of the computational pipeline composed of data quality assessment and model parameterization. (B) Gene expression from simulated testing data and fitted model generated data. Rows correspond to the 93 GRSs in the same order as in Fig 2C. Columns corresponds to the 26 amplitude perturbation conditions at 0, 15, 30, 60 min. (C) Bar plot presenting the number of correctly identified logic gate and boxplot of estimated parameters for 93 GRSs fitted models. Percentage of estimated parameters within 2-fold of the true value are for Time-Value model, Conventional model, raw variance respectively: Kd1 95%, 91%, 70%; Kd2 91%, 84%, 70%; Kd3 91%, 90%, 71%. The mean absolute percent deviations are for Time-Value model, Conventional model, raw variance respectively: Kd1 24%, 28%, 58%; Kd2 26%, 36%, 48%; Kd3 23%, 28%, 138%.

