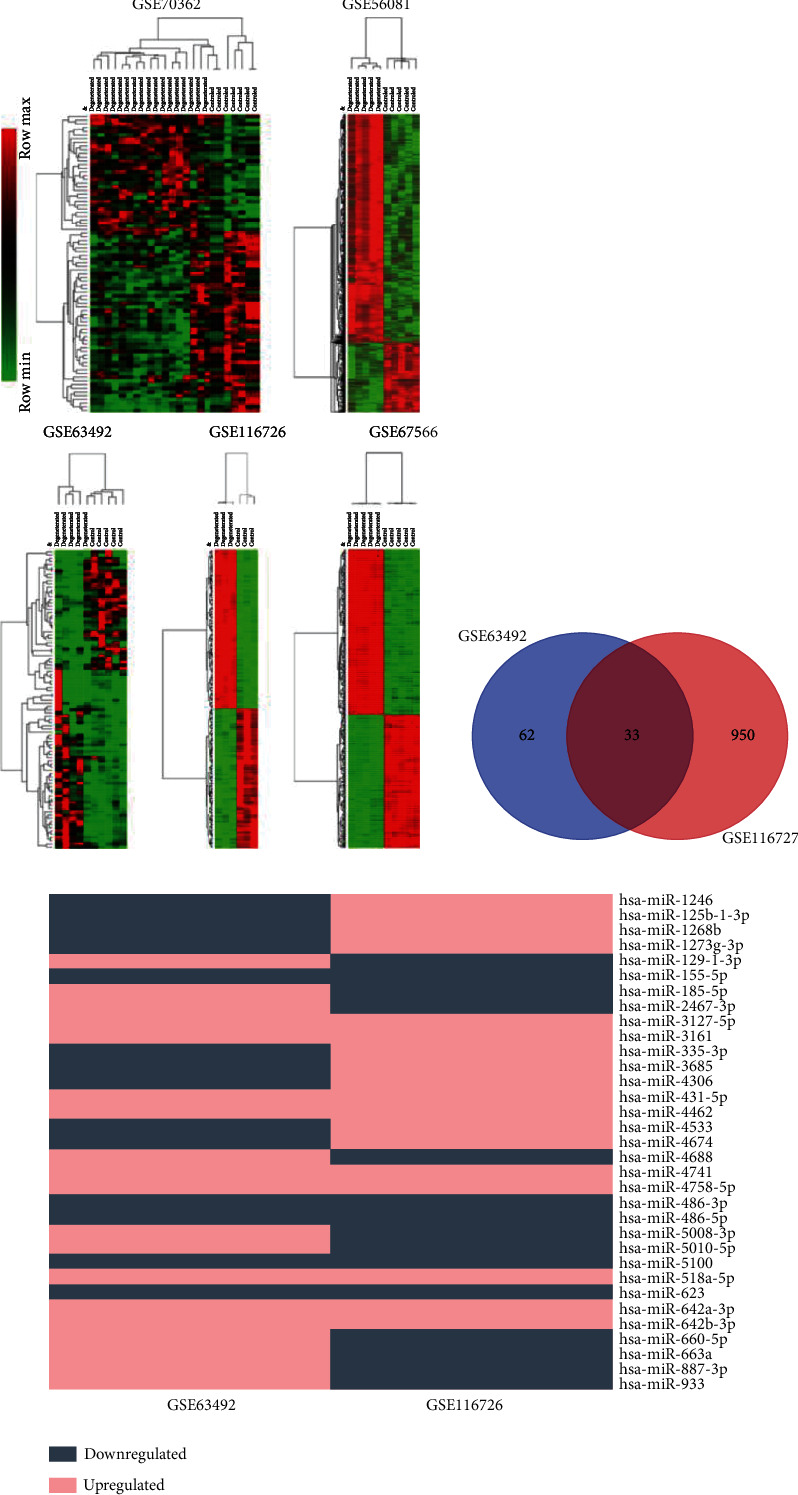
Figure 2.

Analysis of differentially expressed RNAs in each dataset. (a) Hierarchical clustering and heat map analysis of differentially expressed RNAs in each dataset. (b) Venn diagram of differentially expressed miRNAs between GSE63492 and GSE116726. (c) A diagram that exhibits the expressions of the 33 miRNAs in the two datasets, and 14 DEMs with consistent expression were ultimately selected, among which 9 were upregulated and 5 were downregulated.
