Figure 3.

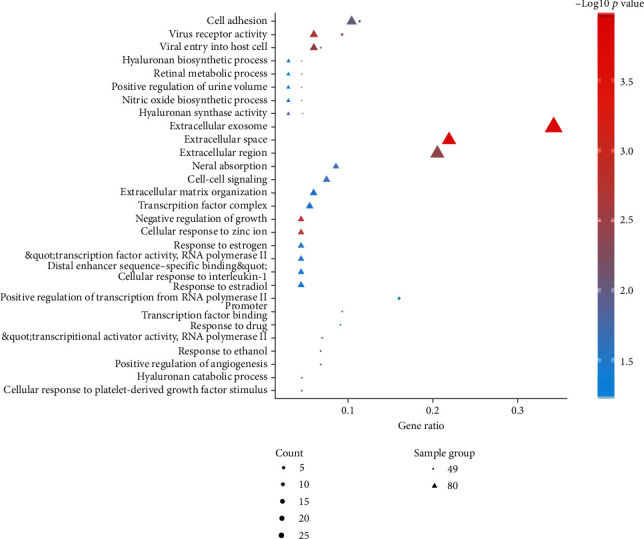
The bubble diagram of gene ontology function enrichment analysis of 80 DEGs and 49 genes that formed the miRNA–mRNA interaction relationship.

The bubble diagram of gene ontology function enrichment analysis of 80 DEGs and 49 genes that formed the miRNA–mRNA interaction relationship.