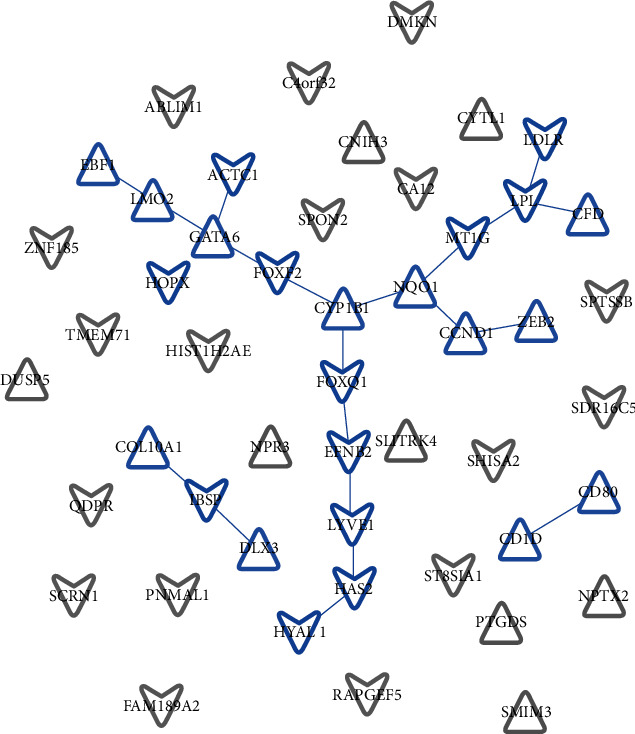
Figure 4.

Protein-protein interaction network. Network nodes represent the proteins produced by a single protein-coding gene locus. Blue represents the proteins that jointly contribute to a shared function but do not necessarily mean that they are physically binding each other. Grey represents the proteins without association. Triangle means upregulated expression, whereas arrow means downregulated expression.
