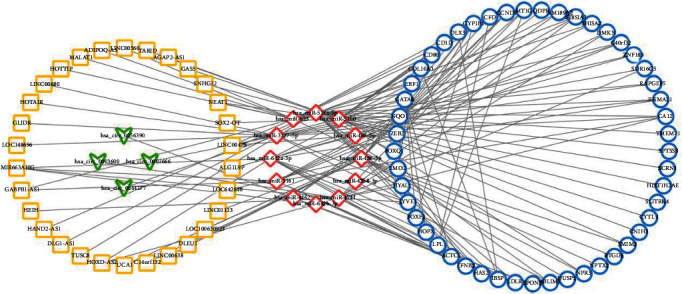
Figure 5.

Competing endogenous RNA interaction network of lncRNA/circRNA–miRNA–mRNA. Yellow represents lncRNA, green represents circRNA, red represents miRNA, and blue represents mRNA. Triangle means upregulated expression, whereas arrow means downregulated expression.
