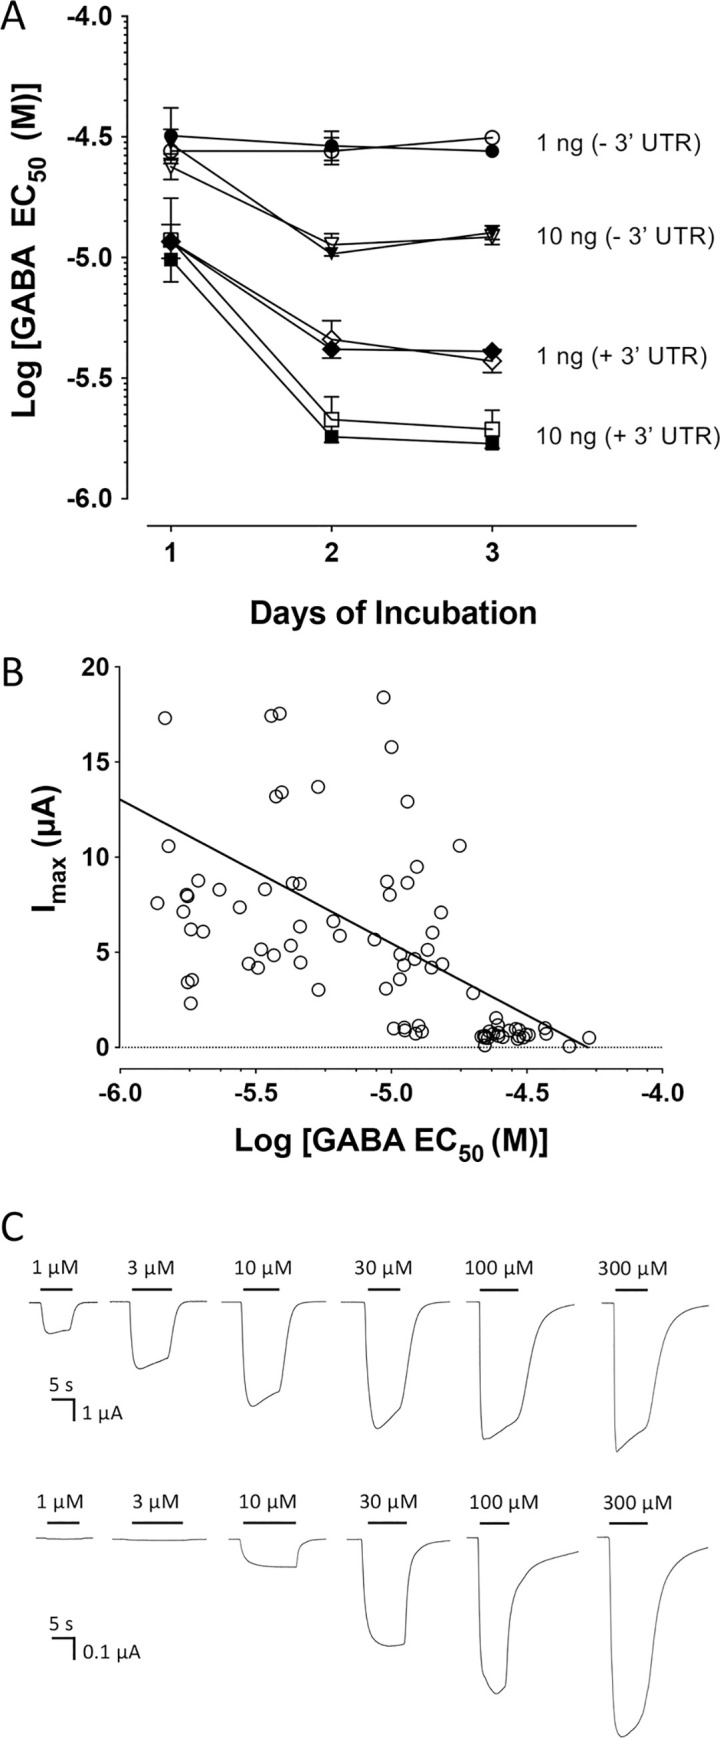
Fig 3. Changes in apparent affinity and current amplitude of BtRDL for GABA in oocytes under differing expression conditions.

A) Apparent affinity for GABA is influenced by the amount of cRNA injected (1 ng or 10 ng), the presence or absence of a 3’ UTR (+3’UTR and -3’UTA), and the length of time post-injection before agonist responses were recorded (one- to three-days). Data are presented with 1 ng cRNA lacking a 3’ UTR (circles), 10 ng cRNA lacking a 3’ UTR (triangles), 1 ng cRNA containing a 3’ UTR (diamonds), 10 ng cRNA containing a 3’ UTR (squares). In all cases independent data were generated from cRNA synthesised from either pSP64GL (open symbols) and pGEMHE (filled symbol). B) Correlation between apparent affinity for GABA (EC50) and current amplitude (Imax). Individual GABA EC50 values are plotted against the GABA Imax, together with a line of best fit. Data are from 88 independently determined EC50 values from oocytes expressing BtRDL under a variety of expression conditions. This includes variations in the amount of cRNA (1 or 10 ng), the length of time post-injection (one-, two- or three-days) or the presence or absence of the 3’ UTR. C) Representative traces from oocytes expressing BtRDL, in response to application of a range of concentrations of GABA. Upper traces correspond to oocytes injected with 10 ng cRNA containing a 3’ UTR. Lower traces correspond to oocytes injected with 1 ng cRNA lacking a 3’ UTR. In both cases recordings were made three-days post-injection. Note: the vertical axis of the scale bars differs by a factor of 10.
