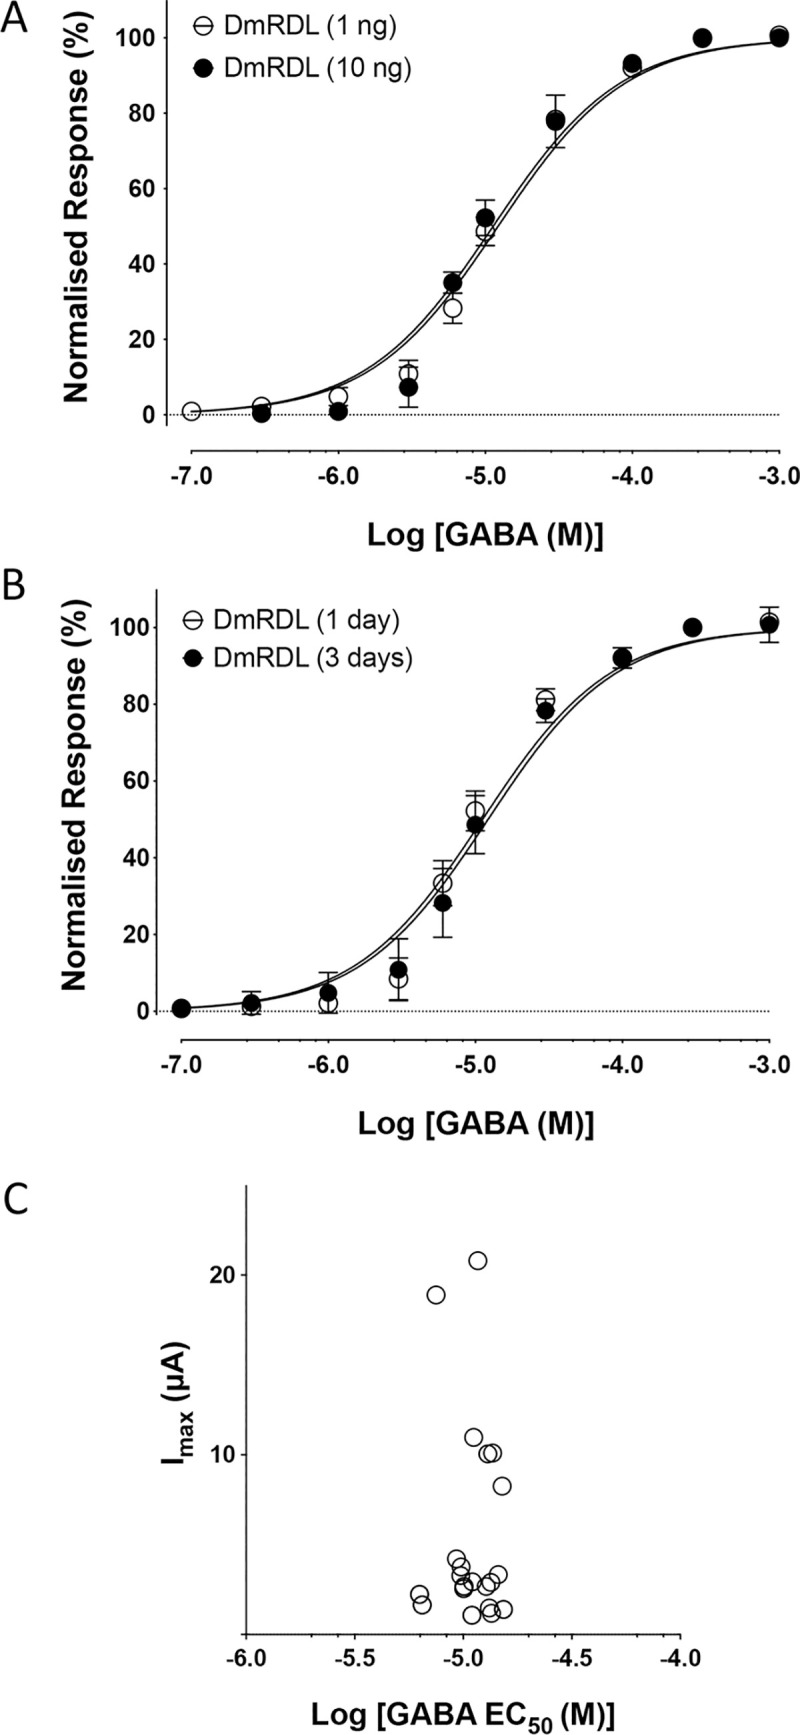
Fig 6. Absence of changes in apparent affinity for GABA in oocytes expressing DmRDL under differing expression conditions.

A) GABA dose-response curves from oocytes injected with either 1 ng cRNA (open circles) or 10 ng cRNA (filled circles) synthesised from pGEMHE-BtRDL and recorded two-days post-injection. B) GABA dose-response curves from oocytes injected with cRNA (1 ng) synthesised from pGEMHE-BtRDL and recorded at either one-day post-injection (open circles) or three-days post-injection (filled circles). In all cases, data are means ± SEM from at least five independent experiments. C) Individual GABA EC50 values are plotted against the GABA Imax. Data are from 28 independently determined EC50 values from oocytes expressing BtRDL under a variety of expression conditions.
