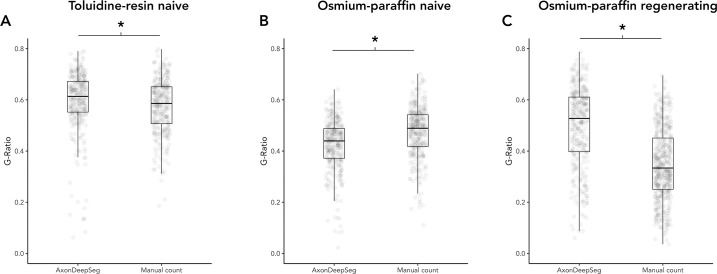
Fig 7. Comparison of g-ratio measured by ADS or manually.
(A) Naïve nerves, toluidine-resin protocol, mean g-ratio for all micrographs for both nerves. (B) Naïve nerves, osmium-paraffin protocol, mean g-ratio for all micrographs for both nerves. (C) Regenerating nerves, osmium-paraffin protocol, mean g-ratio for all micrographs for both nerves. Asterisk (*) = significant (P < 0.05 by two-sample t-test). Boxes are 1 interquartile range (IQR), whiskers 1.5*IQR.

