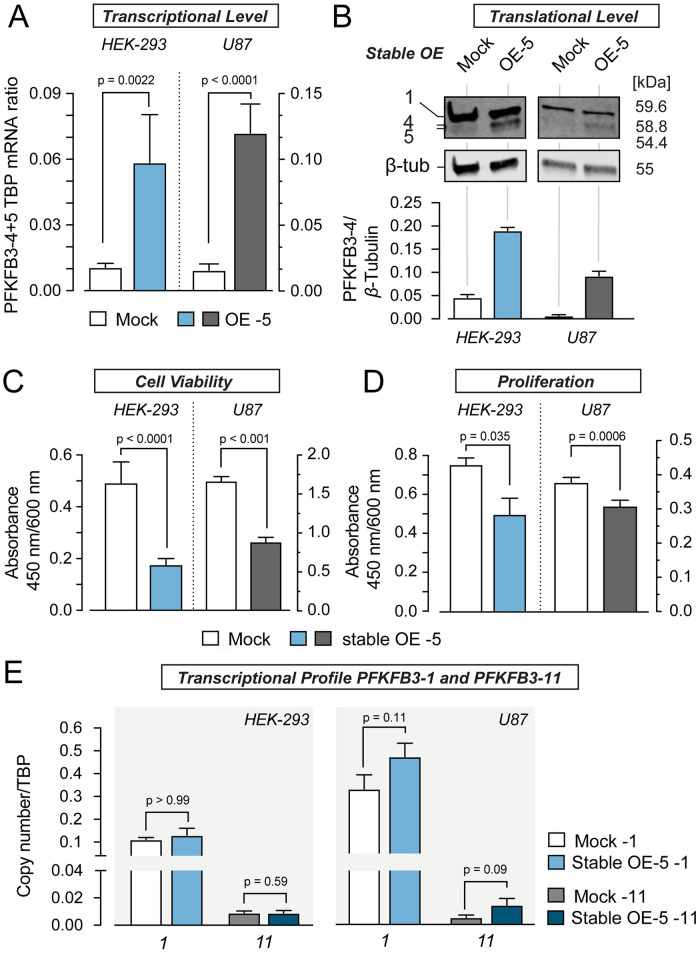
Fig 6. Stable overexpression of PFKFB3-5 in HEK-293 and U87 cells leads to decreased cell viability and proliferation while leaving transcriptional profile of PFKFB3-1 and -11 unaltered.
(A) Quantification of PFKFB3-5 mRNA levels from HEK-293 (blue) and U87 (grey) cells stably overexpressing PFKFB3-5 (OE -5). PFKFB3-5 mRNA quantity was normalized to the amount of TBP mRNA measured by quantitative PCR and compared to mock samples (for HEK-293: N = 3, n = 2, for U87: N = 4, n = 3). (B) Shows western blot analysis to confirm the overexpression of PFKFB3-5 with polyclonal PFKFB3 antibody. β-Tubulin served as loading control, 10 μg protein were loaded per lane. 1 means PFKFB3-1 and 4 PFKFB-4. The ratio of protein bands (PFKFB3-5 to β-Tubulin) was calculated from the intensity values of protein bands (n = 3). (C) Effect of stable PFKFB3-5 overexpression on cell viability, measured by WST-1 assay. After a 4 h incubation period with WST-1 reagent the absorbance was measured at 450 nm/ 600 nm (N = 4, n = 5–7). (D) Effect of stable PFKFB3-5 overexpression on proliferation measured by BrdU-assay. After 20 h incubation period with BrdU, the absorbance was measured at 450 nm/600 nm (N = 3, n = 6–8). (E) Influence of stable overexpression of PFKFB3-5 on the mRNA levels of PFKFB3-1 and PFKFB3-11 compared to mock samples (N = 3, n = 2 for HEK-293 cells and N = 4, n = 3 for U87 cells). All values represent the mean ± SEM. All groups were compared using the paired t-test or Mann Whitney test.

