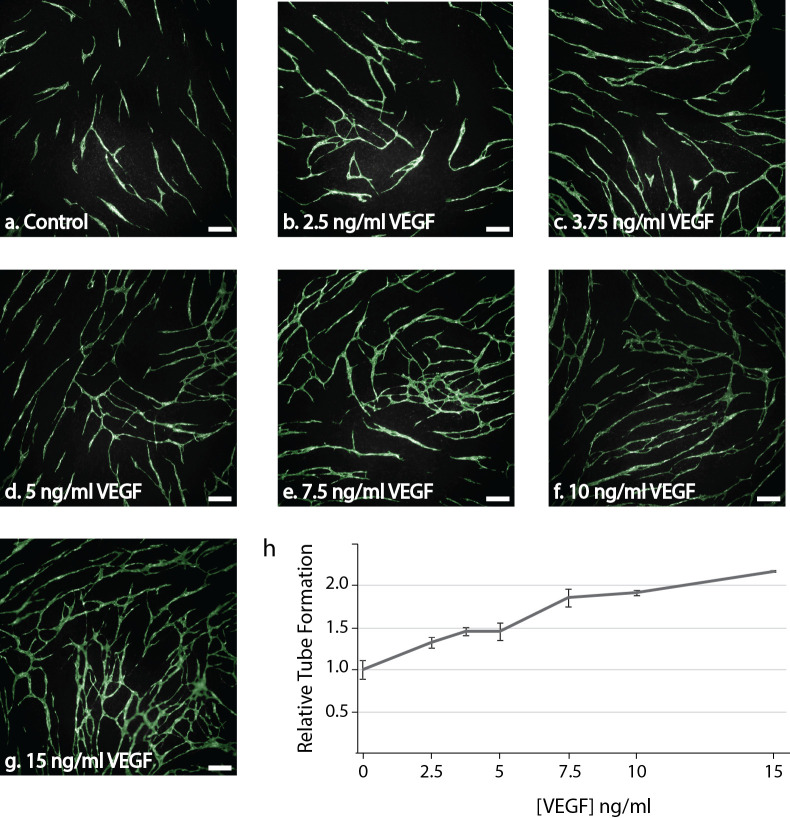
Fig 2. Dose-response curve following treatment with the pro-angiogenic VEGF-A165 (VEGF).
HUVECs were seeded on a confluent layer of NHDF on day 5 and cultured with increasing concentrations of VEGF (0–15 ng/ml) from day 7. At the end of the experiment (day 11), the co-cultures were fixed and stained for the endothelial marker PECAM-1 to reveal the tubes. (a-g) Representative fluorescent images (5x) obtained with the Array Scanner VTI with green overlay from the tube algorithm of PECAM-1 positive cells following treatment with (a) 0 ng/ml VEGF (Control), (b) 2.5 ng/ml VEGF, (c) 3.75 ng/ml VEGF, (d) 5 ng/m VEGF, (e) 7.5 ng/ml VEGF, (f) 10 ng/ml VEGF or (g) 15 ng/ml VEGF. Bar 200 μm. (h) Quantification of tube area in samples treated with increasing concentrations of VEGF. Tubes were quantified with the BioSense Solutions and 2cureX tube algorithm. Two independent experiments were performed with representative results displayed. Data are the average of triplicate samples ± SD.

