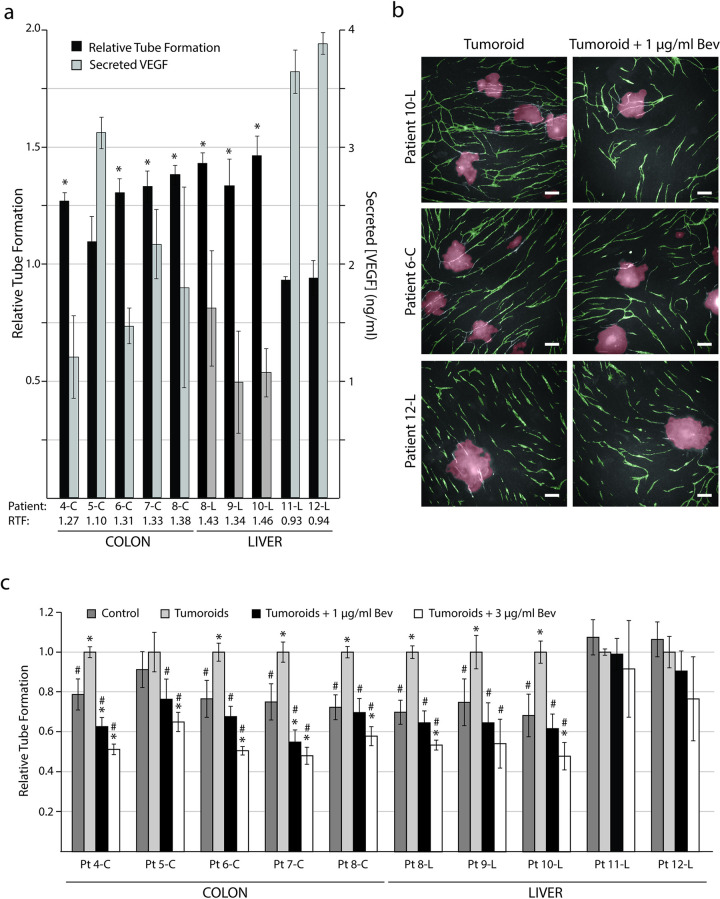
Fig 5. Patient-derived tumoroids can induce increased tube formation.
Tumoroids were introduced to the CACC assay on day 7. At the end of the experiment (day 11) the co-cultures were fixed and stained for the endothelial marker PECAM-1 to reveal the tubes. Tubes were quantified with the BioSense Solutions and 2cureX tube algorithm. (a) Left axis: Relative tube formation (RTF) for 10 patient-derived tumoroid cultures. Tube formation is expressed relative to control sample without tumoroids. Data are the average of triplicate samples ± SD, * p<0.05 for samples with tumoroids vs. control. Right axis: Tumoroid-secreted VEGF-A (VEGF) measured in culture medium collected from the CACC assay (day 11) and assayed for VEGF by ELISA. Data are the average of triplicate samples ± SD. (b) Representative images (5x objective) of tube formation on day 11 following addition of tumoroids from patient 1x0-L (high induction of tubes), patient 6-C (high to medium induction of tubes) and patient 12-L (no induction of tubes). Images were obtained with the Array Scanner VTI and are shown with green (tubes) and red (tumoroids) overlay from the analysis algorithm. Left column: Tumoroids in control medium. Right column: Tumoroids treated with 1μg/ml bevacizumab (Bev) from day 7 of the CACC assay. Bar 200 μm. (c) Relative tube formation upon addition of patient-derived tumoroids and treatment with 1 or 3 μg/ml bevacizumab from day 7 to 11 in the CACC assay. Tube formation is expressed relative to samples with tumoroids (no treatment). Pt: Patient * p<0.05 for samples vs. control (no tumoroids, no treatment). # p<0.05 for samples vs. tumoroids (no treatment). Data are the average of triplicate samples ± SD.

