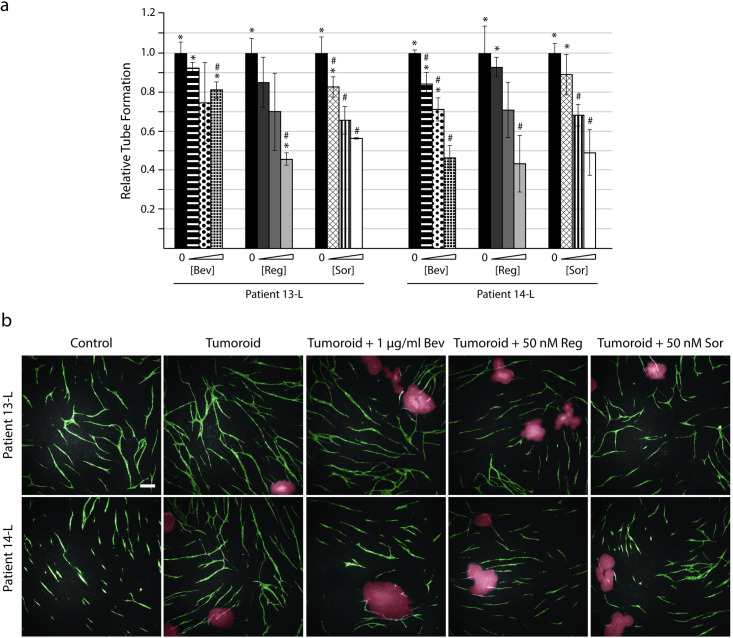
Fig 7. Tumoroids established from liver metastases express different sensitivities to anti-angiogenic treatments.
Tumoroids were introduced to the CACC assay on day 7 ± treatment compounds. At the end of the experiment (day 11) the co-cultures were fixed and stained for the endothelial marker PECAM-1 to reveal tubes. The cultures were treated with increasing concentrations of bevacizumab (Bev; 0.01, 0.1 and 1 μg/ml), regorafenib (Reg; 10, 50 and 100 nM), and sorafenib (Sor; 10, 25, and 50 nM). (a) Tube formation was quantified with the BioSense Solutions and 2cureX tube algorithm and expressed relative to sample with tumoroids (no treatment). Data are the average of triplicate samples ± SD, * p<0.05 for samples vs. control (no tumoroids, no treatment). # p<0.05 for samples vs. tumoroids (no treatment). (b) Representative images (5x objective) of tube formation obtained with the Array Scanner VTI shown with green (tubes) and red (tumoroids) overlay. Bar 200 μm.

