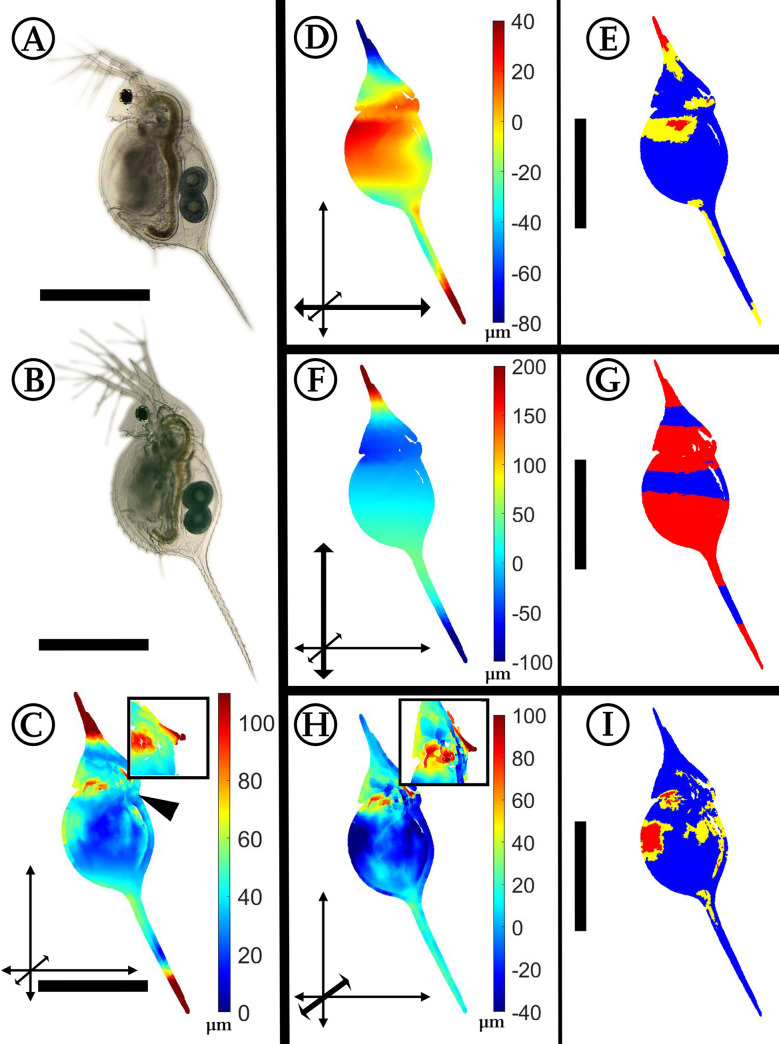
Fig 7. Analysis of Gasterosteus-exposed Daphnia lumholtzi.
(A) D. lumholtzi, unexposed. (B) D. lumholtzi, Gasterosteus-exposed. (C) Overall deformation plot showing the sites of cumulated alteration with blue giving zero and red maximal alteration. The insert shows a detail of the head and especially the region of the fornices. (D, F, H) Vertex displacements along the coordinate axes (x, y, z respectively). Shades of blue colours represent alterations in negative direction, while shades of red display shifts in positive direction on the respective axis. Note the altered colour scale. The coordinate system gives the relevant axis marked in bold (see also Fig 1B). Subfigure H additionally gives an insert with a detail of the laterally strongly extended fornices. (E, G, I) p-values lower than 0.05 displayed in yellow, regions additionally supported by q-values lower than 0.05 based on the FDR-analysis are coloured red. nunexposed = 10, npredator-exposed = 8. All scale bars: 400 μm. ©Fig 7A and 7B: Graeve/Janssen.

