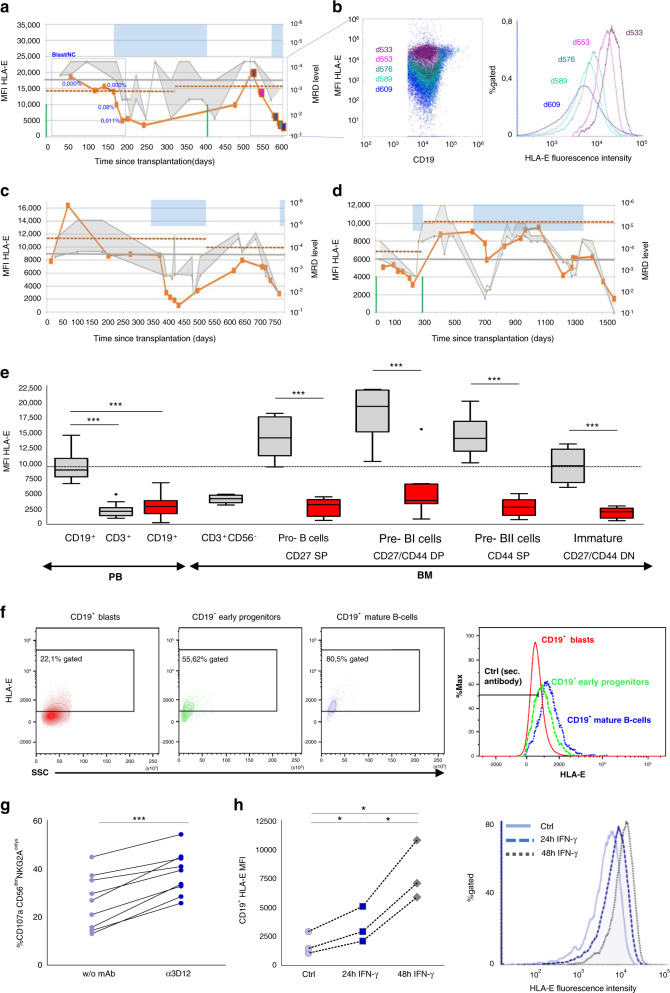
Fig. 2. Leukemic blasts downregulate HLA-E expression to low but tolerogenic levels, which inhibits NK cell activation and correlates with a reoccurrence of the disease.
a, c, d Comparison of HLA-E levels and MRD values in three representative patients undergoing multiple allogeneic HSCTs (gray shaded area: range between minimum and maximum detected PCR MRD levels). The three patients were observed for 1.7–4.3 years by analyzing consecutive PBMC samples and results were correlated with analyses of minimal residual disease (MRD) monitoring (PCR and flow-cytometry) in bone marrow samples. Blue shaded area: indicating antineoplastic treatment modalities (chemotherapy, antibody therapy, CIK cell infusion); vertical green: time point of HSCT, red line: HLA-E surface expression; horizontal gray line: PCR MRD threshold; blue dots: flow-cytometry MRD levels; horizontal dashed red line: HLA-E level of the respective donor. b Dot plot (left panel) and histogram (right panel) overlays showing downregulation of HLA-E expression on CD19+ cells from one representative ALL patient at different time points from transplantation to relapse (day +533 violet; day +553 pink; day +576 dark green; day +589 light green; and day +609 blue). e HLA-E surface expression levels of B cell precursor stages in bone marrow aspirates. Box plots showing staining of HLA-E surface expression on peripheral blood (PB) CD19+ and CD3+ lymphocytes from 29 healthy volunteers (HV: gray), 40 diagnosed ALL patients (ALL: red, initial and relapse samples) and on bone marrow cells from 8 healthy volunteers (gray) and 8 ALL patients (red). b cell precursor stages in bone marrow aspirates were defined as previously reported in Vaskova et al. [8]. The dotted black baseline indicates the mean expression level of HLA-E on CD19+ peripheral blood cells from healthy volunteers. Error bars represent the standard error of the mean. Statistical significance was determined by a Mann–Whitney U test or unpaired t-test (***p < 0.001). f HLA-E surface expression levels of CD19+ blasts, early progenitors (hematogones) and more mature CD19+ B cells. Cell populations and maturity stages were distinguished according to flow MRD standards published by Karawajew et al. [7]. Histogram overlay (right panel) showing downregulation of HLA-E expression on leukemic blasts compared to normal CD19+ cells. g To further elucidate whether suppression of inhibitory signals could enhance NK cell-mediated anti-tumor responses, NKG2A/HLA-E interaction was blocked via αHLA-E (3D12, gray bar). Blocking antibody and cytolytic activity was measured via CD107a mobilization assay. CD107 frequency was measured exclusively on KIR−NKG2A+CD56dim NK−-cells. (h) To determine whether HLA-E downregulation was a reversible process, ALL samples (n = 3) were cultured in the presence or absence of IFNγ (100 U/mL) and HLA-E expression was measured at the indicated time points (left panel). The respective histograms of a representative experiment (right panel) at 0 h (solid violet), 24 h (dashed blue), and 48 h (dotted gray). Statistical significance was determined by one-way-Anova or paired t-test (*p < 0.05, **p < 0.01, ***p < 0.001).

