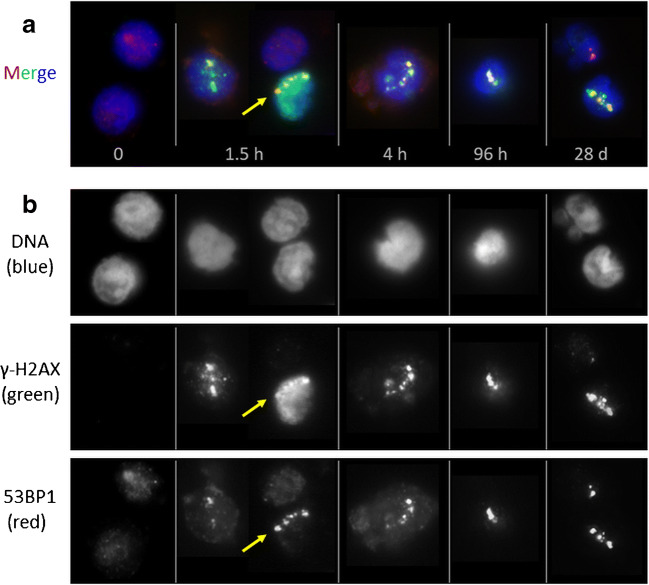
Fig. 2.
a Selection of PBMC nuclei (DNA stained with DAPI, blue) with α-particle hits (α-tracks) stained for γ-H2AX (green) and 53BP1 (red), collected from different patient samples at successive times points after [223Ra]RaCl2 administration. Cells shown reflect the variable morphologies of DNA damage markers along α-tracks seen among patient samples. Cell nuclei of a baseline sample without α-hits are shown for comparison to the left (0). α-tracks were usually composed of a more-or-less linear succession of large γ-H2AX-positve domains that show partial co-localization with large 53BP1 foci (see [21]). The overall green cell of the 1.5h time point (arrow) displays pan-γ-H2AX staining, typically seen in a fraction of cells after high LET irradiation [24]. The α-particle trajectory in this nucleus can be deduced by the succession of the 53BP1 foci (arrow; see red channel below). b Single color channel display of the RGB channel images in a, showing the distribution of the individual DSB marker proteins along the α-induced DNA damage tracks. The channel proteins and colors are indicated to the left. The α-track in the pan-γ-H2AX cell is arrowed

