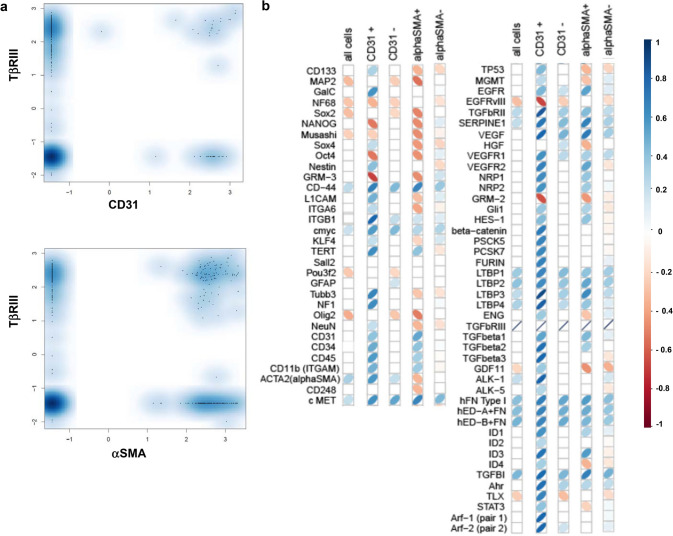
Fig. 2.
TβRIII expression determined by single-cell RT-PCR in freshly dissociated human glioblastomas. a Distribution of TβRIII expression in CD31- or αSMA-negative versus positive populations as determined by single-cell RT-PCR in cells derived from freshly dissociated human glioblastoma (N = 6, pooled). x-axis: normalized relative log2 expression value of CD31 (upper panel) and αSMA- (lower panel), y-axis: normalized relative log2 expression value of TβRIII. b Correlation matrix between TβRIII expression and indicated genes on a single-cell level in all cells and in the CD31-negative- versus the CD31-positive subpopulations. Pearson correlation coefficients are visualized using red or blue tilted symbols, indicating negative or positive correlations, respectively. Only significant correlations with p-values < 0.05 (after Bonferroni correction) are shown

