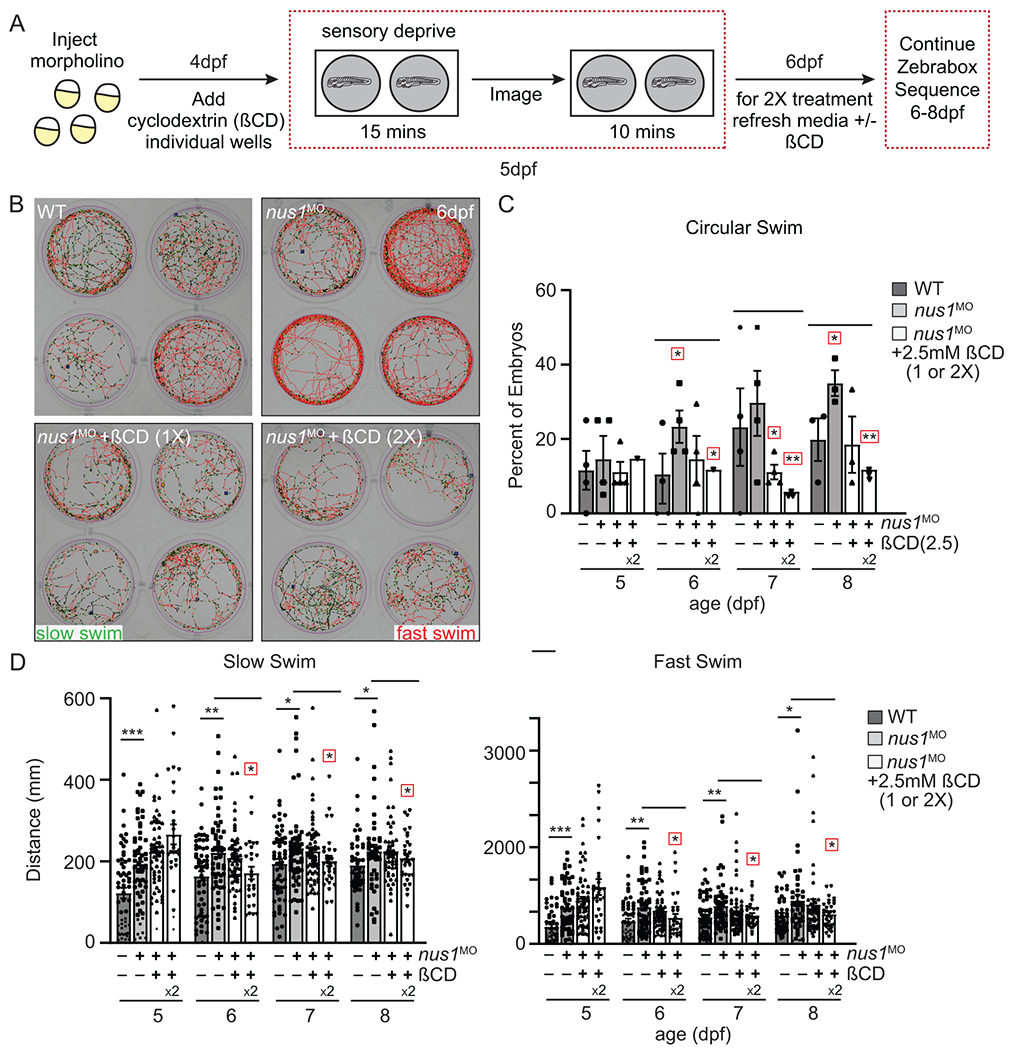
Figure 5: Lowering cholesterol accumulation improves swim behaviors in nus1 morphant embryos.

A) Schematic illustrates workflow for Zebrabox analyses of embryo motility following ßCD treatment. B) Images show 4 representative wells from 12 well plates containing WT, nus1 morphant, or nus1 morphant embryos treated 1 or 2x with 2.5mM ßCD. Traced swim patterns indicate the total path swam by the embryo, as well as swim speed. Red lines indicate a high velocity (fast) swim, while green lines indicate lower velocity (slow) swim. Images show treating nus1 morphants with ßCD reduces both their swim speed and the tendency to swim in a circle around the well. C) Graph showing percent of total embryos swimming exclusively in a circle. D) Graph showing distance swam by an individual embryo (black dot) at slow and fast swim speeds 5-8dpf. Data show that treating nus1 morphants with ßCD twice significantly reduces swim distance, restoring WT-like distances. For all graphs: n=3 experiments, with >25 embryos per “genotype” per condition. Error=S.E.M, significance calculated by the Dunnett’s test where correction for a single control sample was applied. *p<0.05, **p<0.01. ***p<0.0001. Red boxes indicate an additional correction (Dunnett’s test) was applied for comparison to a single control group.
