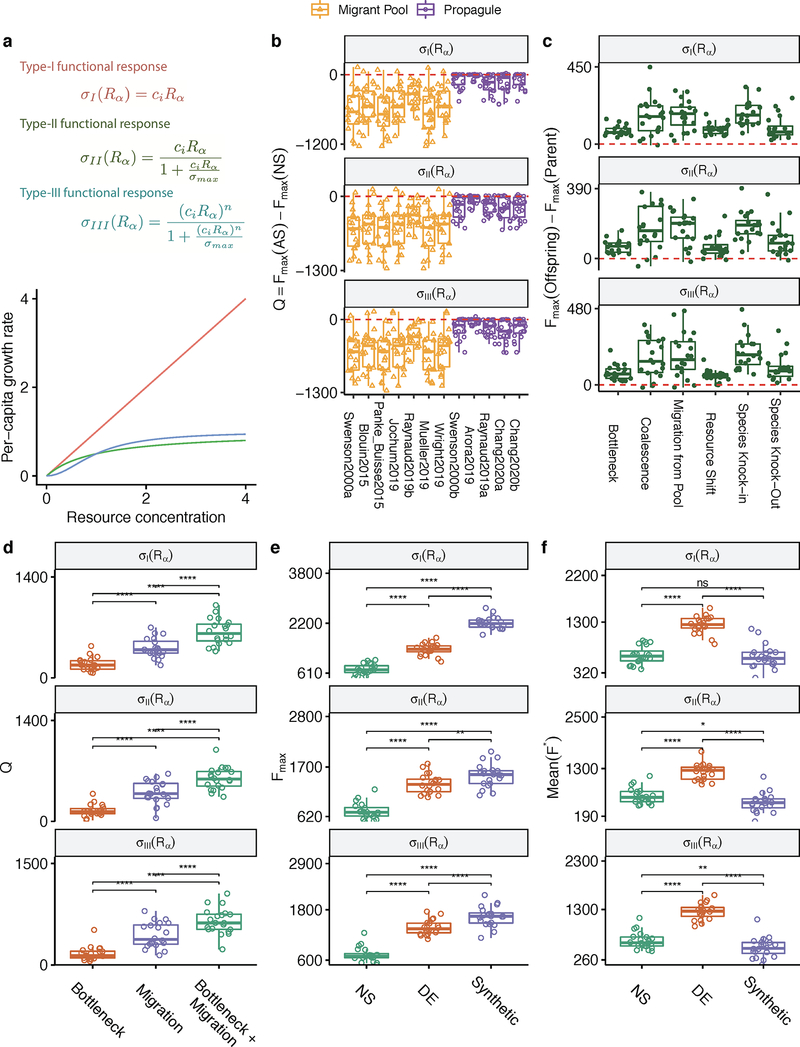
Extended Data Figure 3. Functional responses.
The resource import rate depends on its concentration in the environments, which can take a linear (type I), Monod (type II), or Hill (type III) form. A Type-III functional response is used in the simulation presented in the main text. The layout of (B-F) follows Extended Data Fig. 1B–F, reproducing the main results from Fig. 1–4.

