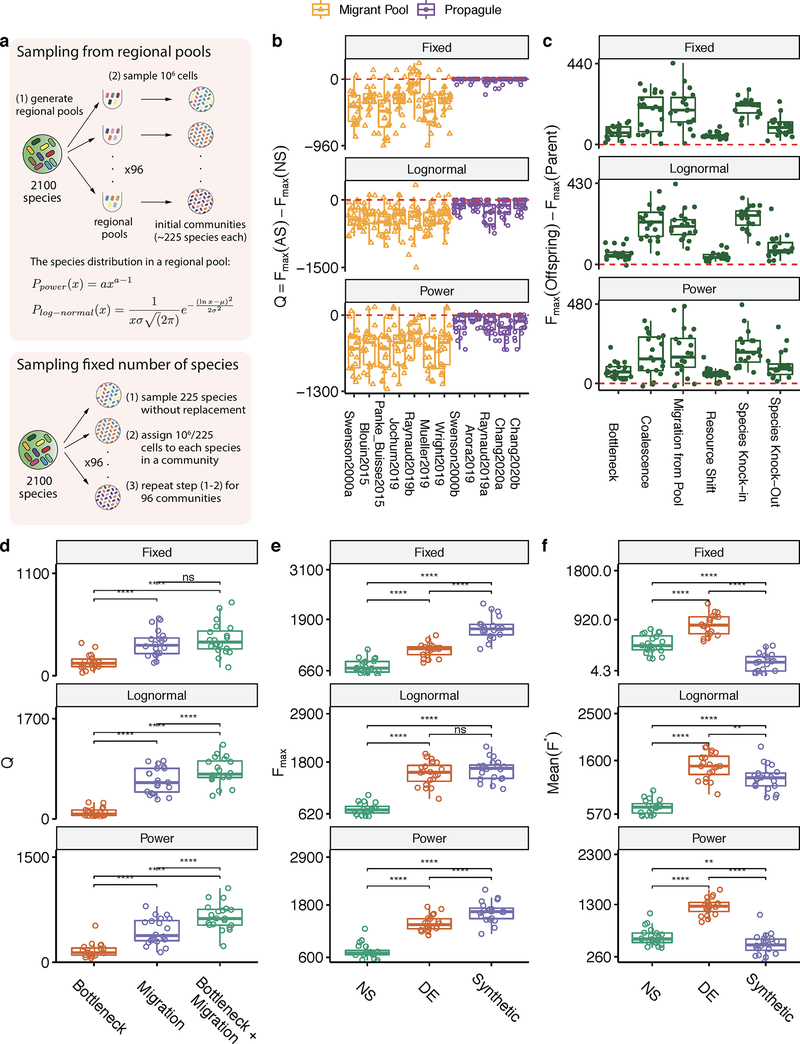
Extended Data Figure 4. Alternative Metacommunity sampling approaches.
We simulate three metacommunity sampling approaches: i) Each community is seeded with 106 cells drawn from a different regional pool, where the species abundances in each regional pool are drawn from a power-law distribution with a = 0.01, ii) Each community is seeded with 106 cells drawn from a different regional, where the species abundances in each regional pool are drawn from a log-normal distribution with mean μ = 8 and standard deviation σ = 8, iii) Each community is seeded with a randomly chosen set of 225 species and they are all set to have the same initial abundance. The simulation in the main text adopts the power-law distribution approach. The layout of (B-F) follows Extended Data Fig. 1B–F, reproducing the main results from Fig. 1–4.

