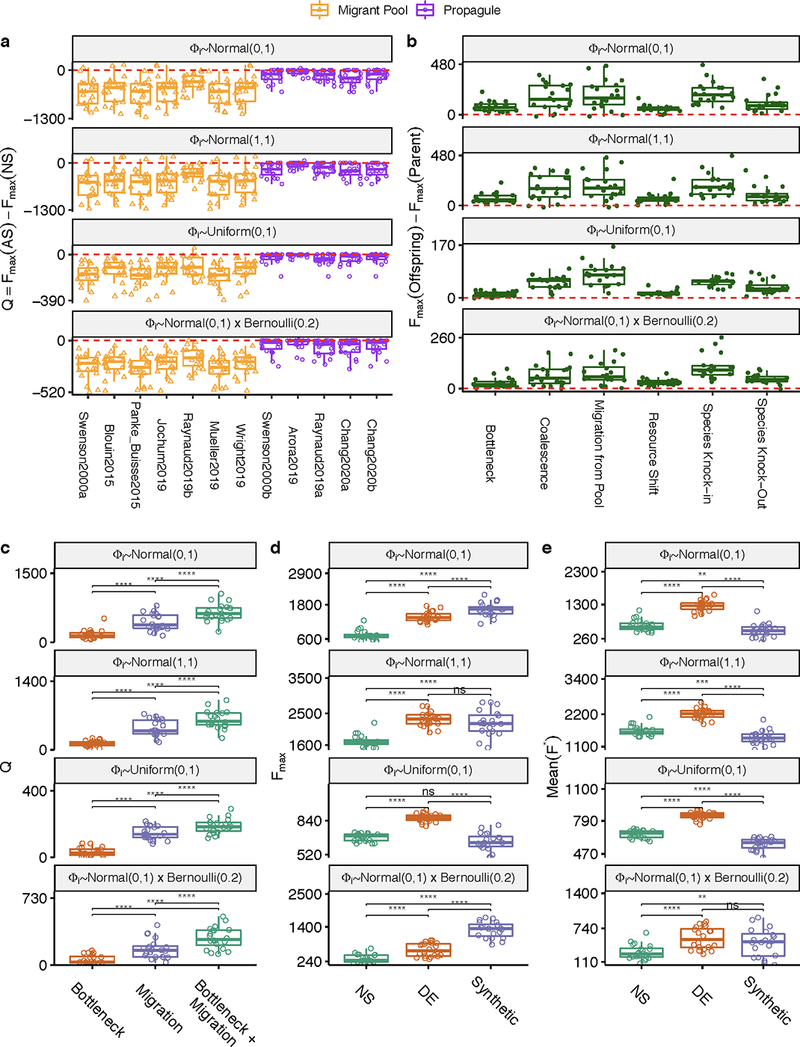
Extended Data Figure 5. Different distributions of per capita species contribution to additive community function.

Per capita species contribution drawn from i) normal distribution centered around 0 with standard deviation sd=1, ii) normal distribution with mean=11 and sd=1, iii) uniform distribution ranged from min=0 to max=1, iiii) a sparse additive function where 20% of the species contribute to community function.In the main text, per capita species contribution uses normal distribution with mean=0 and sd=1. The layout of (B-F) follows Extended Data Fig. 1B–F, reproducing the main results from Fig. 1–4.
