
Figure 2: Hepatic squalene synthase (SQS) expression measured by Western blot and normalized by expression levels of β-actin.
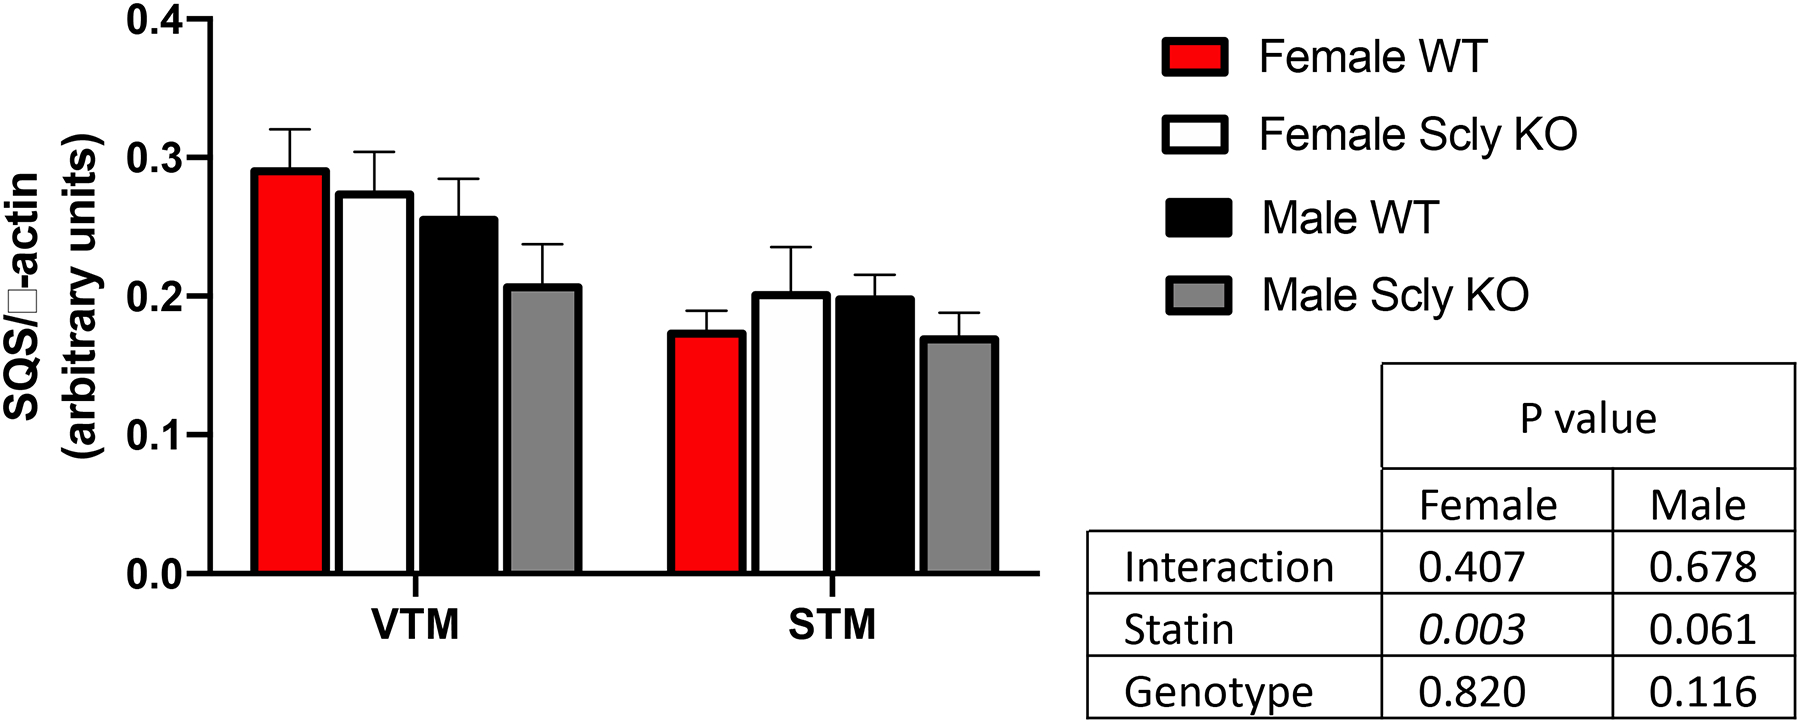
n = 3–4 per group. Two-way ANOVA was applied, considering the differences between treatments (VTM × STM) and/or between genotypes (WT × KO), for males and females separately, and P values are displayed in the inset table. VTM: vehicle-treated mice; STM: statin-treated mice; WT: wild type; KO: knockout.