
Figure 4: Hepatic protein levels in male (A–E) and female (F–J) mice.
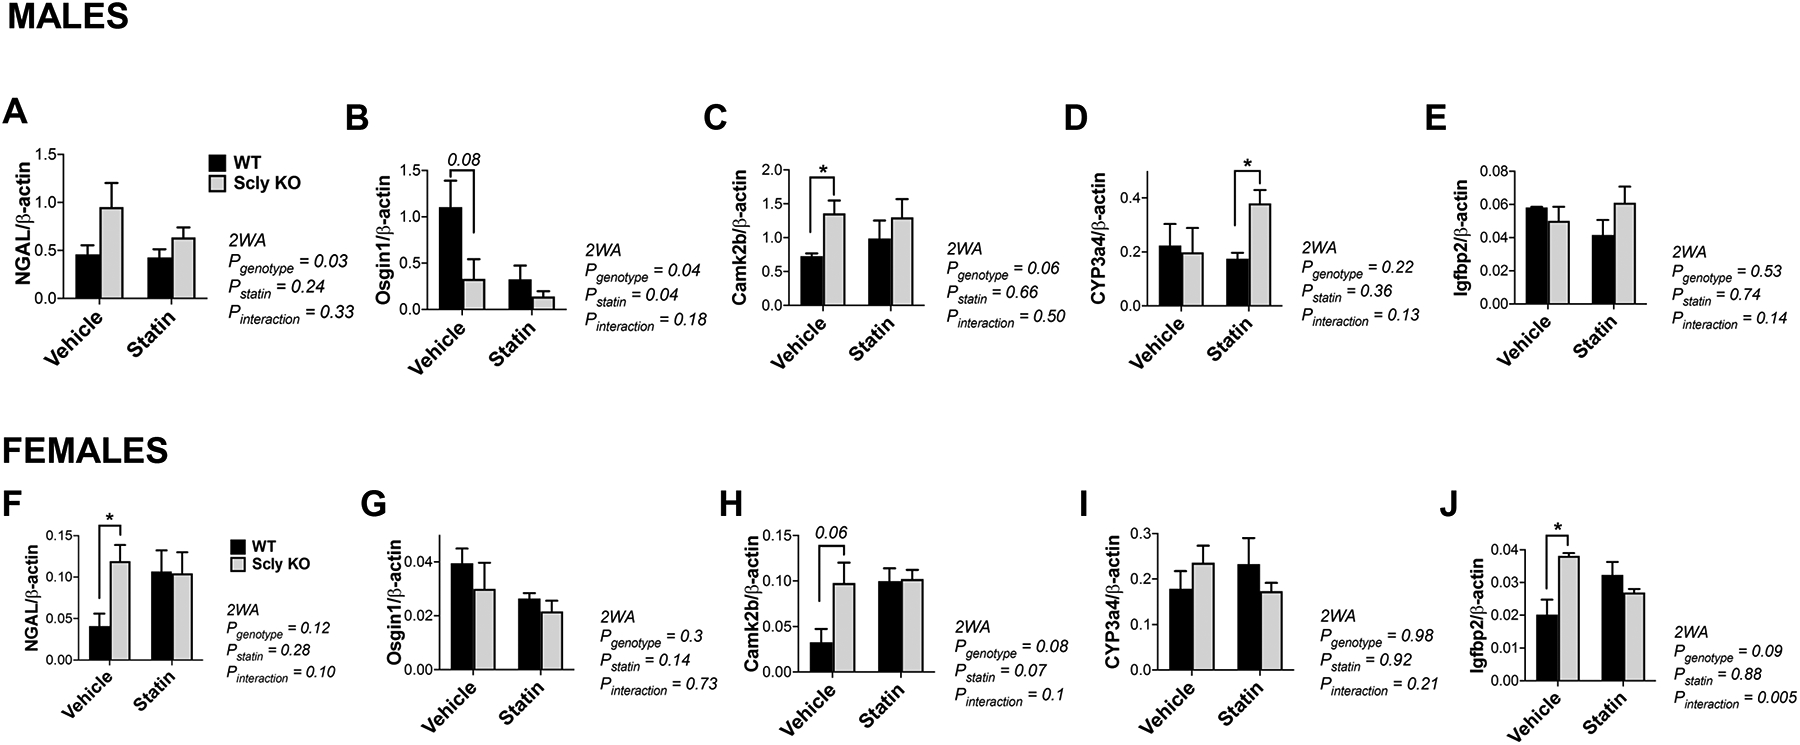
Levels of (A, F) NGAL, (B, G) Osgin1, (C, H) Camk2b, (D, I) CYP3a4, (E, J) Igfbp2 were assessed by Western Blot, with results normalized by the expression of β-actin. Data are mean ± SEM. Two-way ANOVA (2WA) was performed and *, ** and *** represent P<0.05, P<0.01, and P<0.001 respectively, after Bonferroni’s post-test; n=4 per group. Black bars, WT; gray bars, Scly KO.