Fig. 3.
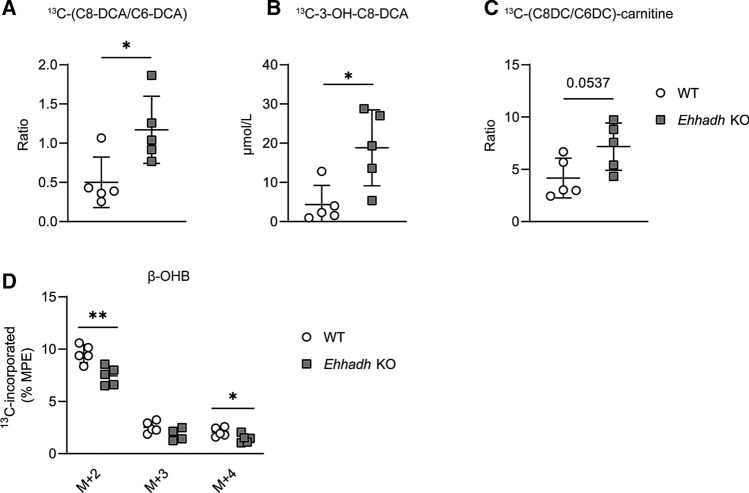
Metabolic tracing of [U-13C]-C12-DCA in precision-cut mouse liver slices. A–C Measured [U-13C]-labeled C6-DCA, C8-DCA, and 3-OH-C8-DCA (µmol/L) in media after 24-h incubation of WT and Ehhadh KO liver slices with [U-13C]-C12-DCA, and calculation of the corresponding C8DCA- to C6-DCA (A) and C8-DC- to C6-DC-carnitine (B) ratios. D MPE (molar percent enrichment) of individual 13C-labeled mass isotopomers of β-OHB in liver slices after 24-h incubation with [U-13C]-C12-DCA. Data are represented individually with the mean ± S.D. Statistical significance was tested using unpaired t-test with Welch’s correction. *P < 0.05; **P < 0.01

