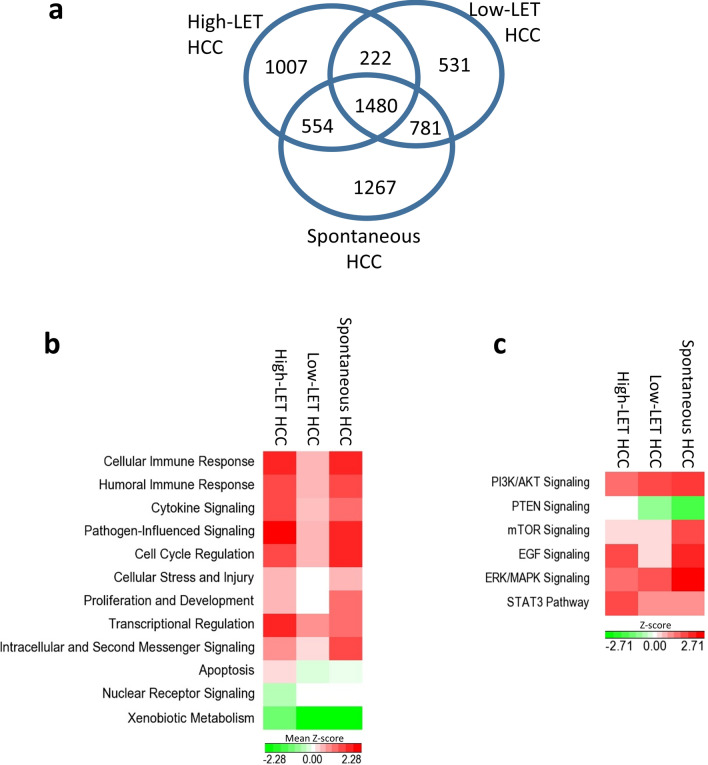
Figure 2.
Differential gene expression and signaling pathways analysis. (a) Venn diagram shows the number of differentially expressed genes in different types of mouse HCC in comparison with normal mouse liver. (b) Canonical signaling pathways that changed in each type of mouse HCC were summarized into functional groups. The heatmap shows averaged z-scores of all pathways within each functional category. A positive z-score indicates activation; a negative z-score indicates suppression. (c) Signaling pathways known to be associated with human HCC also changed in mouse HCC models. Z-scores representing activation (positive) or suppression (negative) of the pathways were shown as a heatmap.

