Figure 5.
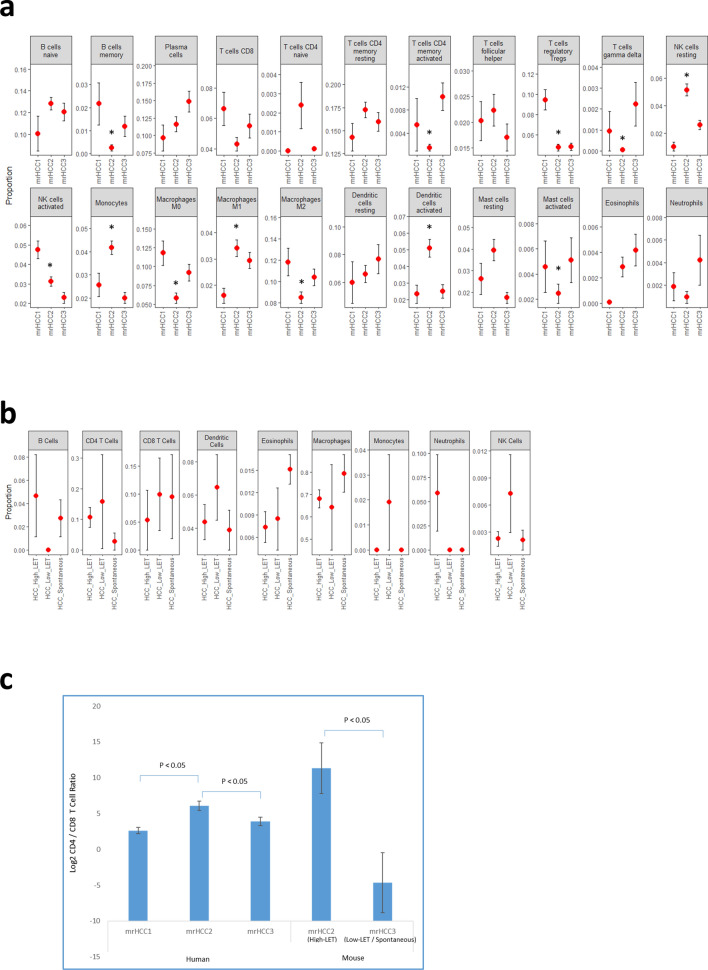
Profiles of tumor-infiltrating immune cells in mouse and human HCC. (a) Average values of relative proportions of immune cells in each mrHCC cluster of human TCGA HCC cohorts. Bar: standard error. *Immune cell proportions of mrHCC2 were significantly different from either mrHCC1 or mrHCC3 (p < 0.05). (b) Average values of relative proportions of immune cells in high-LET, low-LET and spontaneous mouse HCC. Bar: standard error. (c) Ratios of CD4+/CD8+ tumor-infiltrating T cells in different subgroups of mouse and human HCC. Bar: standard error.

