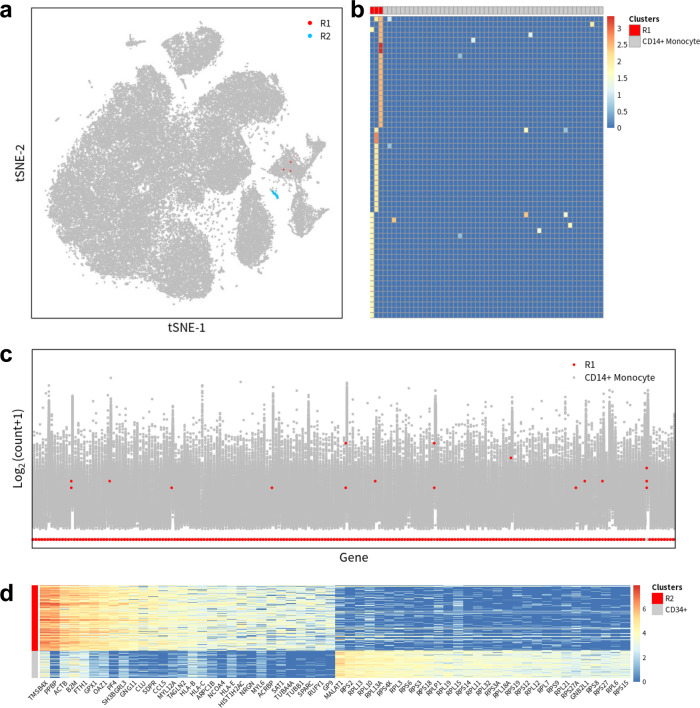
Fig. 6. Identification of novel, rare cell types from the 68 k PBMC dataset.
a The tSNE plot of the full 68 k PBMC dataset with rare cell types labeled in different colours. b Heatmap of the top differentially expressed genes between minor cluster R1 and the remaining CD14+ monocytes. c Expression distribution of 218 genes with absolute log2 fold-change larger than 1 between the minor cluster R1 and the remaining CD14+ monocytes. d Heatmap of the top differentially expressed genes between minor cluster R2 and the remaining CD34+ cell population.

