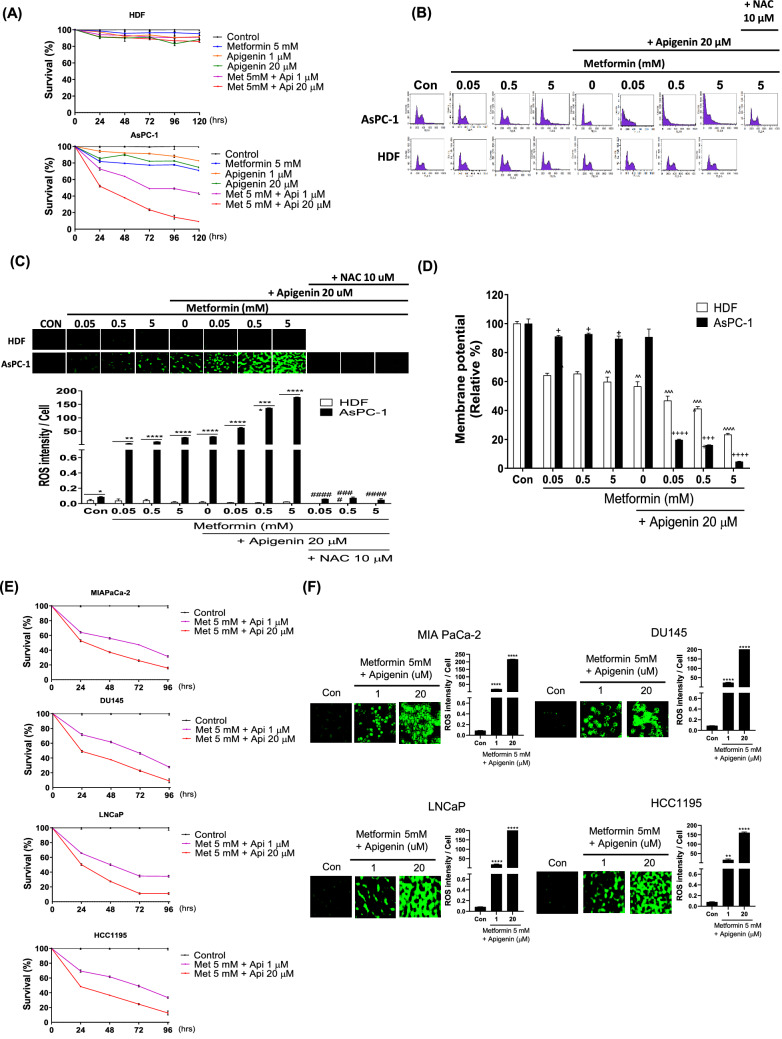
Figure 4.
Effect of combination metformin/apigenin on cell growth, cell cycle, cellular ROS and mitochondrial membrane potential in AsPC-1 and HDF cells. (A) The effect of combination of metformin/apigenin on cell proliferation/viability in AsPC-1 and HDF cells. The cells were treated with metformin (5 mM) alone, apigenin (1 or 20 µM) alone or metformin/apigenin combination for 24 to 120 h and the cell proliferation/viability was assessed by MTT assay. (B) Cell cycle was analyzed with PI staining of the cells (AsPC-1 and HDF) treated with metformin (0.05, 0.5 or 5 mM) alone, apigenin (20 µM) alone or metformin/apigenin combination. (C) Cellular ROS levels of metformin-treated (for 24 h) in AsPC-1 and HDF cells were measured by CellROX Green staining when cells (AsPC-1 and HDF) were treated with metformin (0.05, 0.5 or 5 mM), apigenin (20 µM) or combination of metformin and apigenin for 24 h. (D) Mitochondrial membrane potentials were measured when cells (AsPC-1 and HDF) were treated with metformin (0.5 or 5 mM), apigenin (20 µM) or combination of metformin/apigenin for 24 h. Effect of NAC (N-acetyl cysteine, 10 µM) pretreatment on ROS production (A) and cell death (B) induced by combination of metformin/apigenin was examined. The effects of combination of metformin (5 mM)/apigenin (1 and 20 μM) on cell proliferation/viability (E) and cellular ROS level (F) in MIAPaCa-2, DU145, LNCaP and HCC1195 cells. Three different measurements were performed for each sample. Statistical significance is indicated as *p < 0.05, **p < 0.01, and ****p < 0.0001 compared with control group. ####p < 0.0001 compared with metformin (0.05, 0.5 or 5 mM)/apigenin (20 µM) treated group. +p < 0.05, +++p < 0.01, and ++++p < 0.0001 compared with ASPC-1 control group. ^^p < 0.01, ^^^p < 0.001 and ^^^^p < 0.0001 compared with HDF control group.

