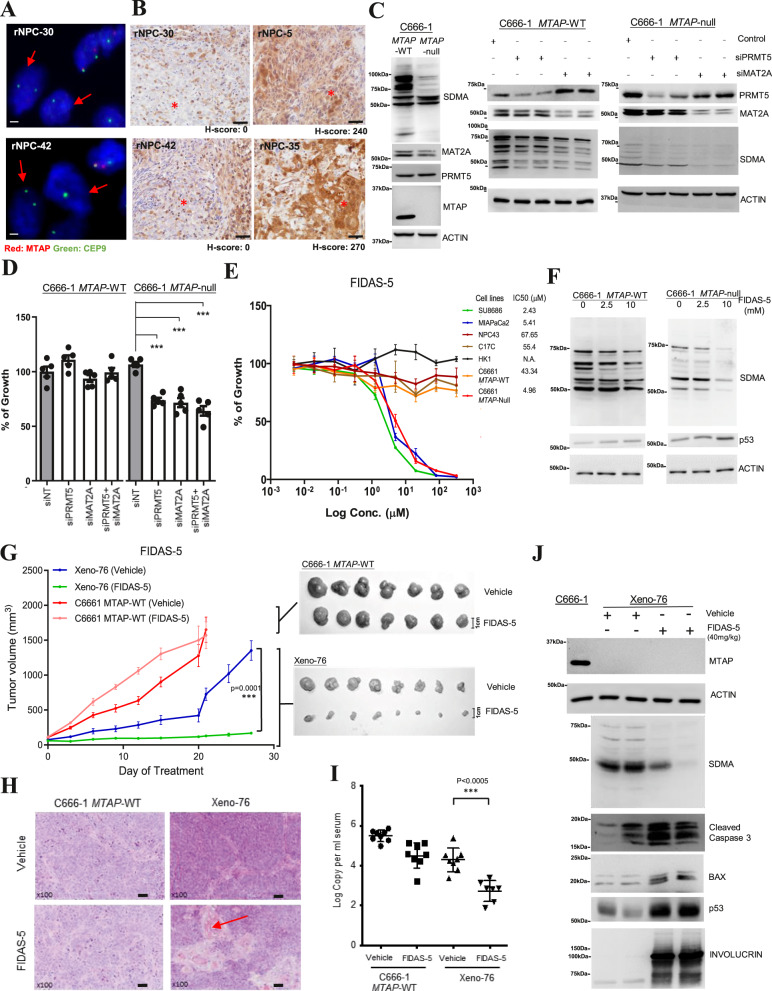
Fig. 7. MTAP deletion is pharmacologically vulnerable to MAT2A inhibition.
A FISH analysis detected homozygous deletion of MTAP in two NPC tumors (rNPC-30, rNPC-42). Scale bar: 1 μm. B Loss of MTAP expression was confirmed in MTAP-deleted NPC tumors (rNPC-30, rNPC-42) by IHC. In two NPC tumors without MTAP deletion, rNPC-5 and rNPC-35, representative images of MTAP expression were shown. Scale bar: 20 μm. Similar results were found in n = 2 independent FISH and IHC experiments. C Loss of MTAP expression and reduced SDMA in MTAP-null C666-1 cells. Knockdown of MAT2A and PRMT5 by siRNAs repressed SDMA in MTAP-null C666-1 cells. Similar effects were observed in n = 3 biologically independent experiments. D Knockdown of MAT2A and PRMT5 significantly inhibited cell growth of MTAP-null C666-1 cells. (unpaired two-tailed t test, ***p < 0.0005; data: mean values ± SEM; n = 5 biologically independent experiments). E FIDAS-5 inhibited the cell growth in MTAP-null C666-1 cells, but not parental C666-1 and MTAP-intact NPC cells (NPC43, C17C, HK1). The MTAP-deleted SU8686 and MIAPaCa2 cells were included as controls. IC50 of each cell line is shown (Data: mean values ± SEM). Replication: n = 5 biologically independent experiments. F Reduced SDMA and increased p53 expression were observed in FIDAS-5 treated MTAP-null C666-1. Similar findings were detected in n = 3 biologically independent experiments. G Marked in vivo inhibition of MTAP-deleted Xeno-76 by FIDAS-5. Growth curves and harvested tumors of C666-1 (MTAP-WT) (n = 8) and Xeno-76 (n = 7) in nude mice treated with vehicle or FIDAS-5 are shown (unpaired ANOVA test, ***p = 0.0001, data: mean values ± SEM). H The morphological changes (cell differentiation and keratin production (red arrow)) are illustrated in representative H&E-stained tissue sections of FIDAS-5 treated Xeno-76. Scale bar: 50 μm. I Circulating EBV DNA copies were significantly reduced in the Xeno-76 mice after FIDAS-5 treatment. (Unpaired two-tailed t test, ***p < 0.0005; data: mean values ± SEM). The blood samples examined in each treatment group of Xeno-76 and C666-1 MTAP-WT are n = 8 and n = 7, respectively. J FIDAS-5 treated Xeno-76 showed reduced SDMA, and increased cleaved caspase 3, BAX, p53, and involucrin expression. Similar effects were shown in n = 3 biologically independent experiments. Source data are provided as a Source Data file.

