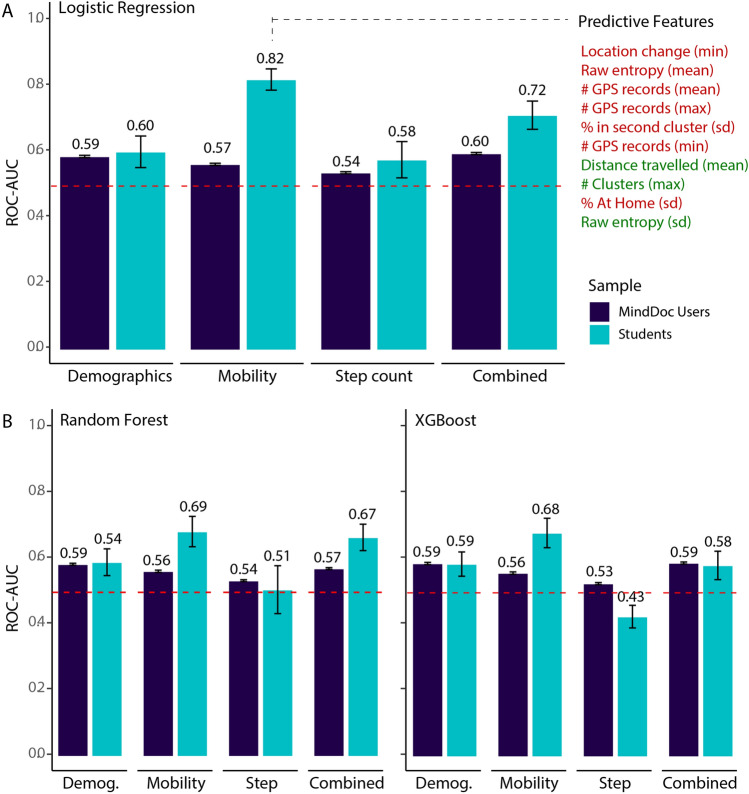
Figure 1.
Predictive accuracies (AUC-ROC) and the 95% confidence intervals across the student and general population samples, using three different classifiers and four different feature sets. (A) Shows the results of logistic regression to predict depression from different data sources in college students (light blue) and the general population sample (dark blue). It also highlights the most predictive features in the mobility model for the student sample. Red (green) indicates a negative (positive) relationship with depression. (B) shows the corresponding results using random forest and XGBoost algorithms. Data collected using the MindDoc app (https://minddoc.de/app).

