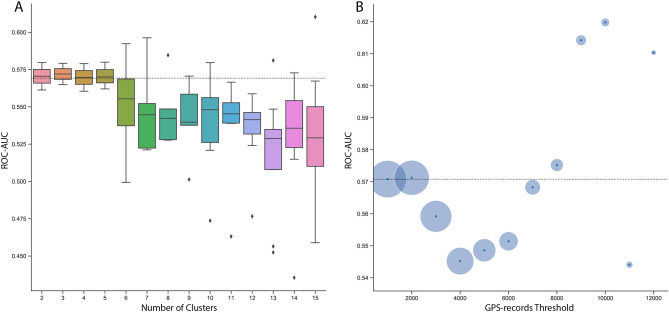
Figure 4.
(a) Distribution of out-of-sample predictive performance (AUC) of clusters determined by K-means algorithm using different numbers of clusters. (b) Average out-of-sample predictive performance (AUC) of subsamples at various thresholds of GPS-records (e.g., 2000 records and higher). The size of the circle indicates the number of participants in each subsample. The dotted line indicates the average AUC score in the MindDoc sample.

