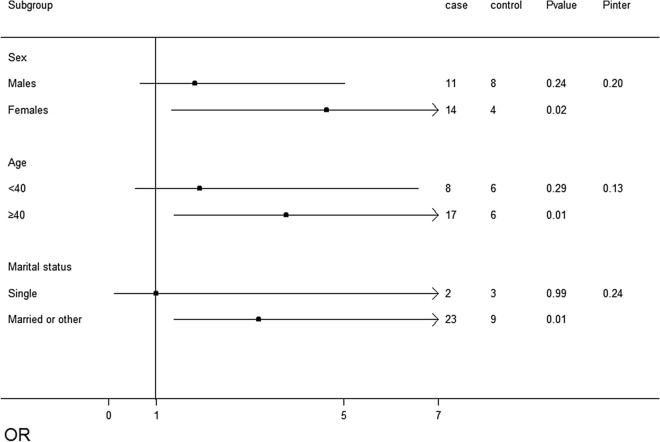
Figure 3.
Association tests of copy number variation (CNVs) losses in patients with non-alcoholic fatty liver disease (NAFLD) across strata for various factors. The Forest plot represents the odds ratios (ORs) of the comparison of carboxylesterase 1 (CES1) CNVs losses versus the neutral CNVs, adjusting for age, sex, education level, occupational status, income, marital status, smoking status, tea drinking status, exercise, history of diabetes, hyperlipidaemia, and hypertension. Pinter indicates the P value for the interaction between the strata and CNVs loss.

