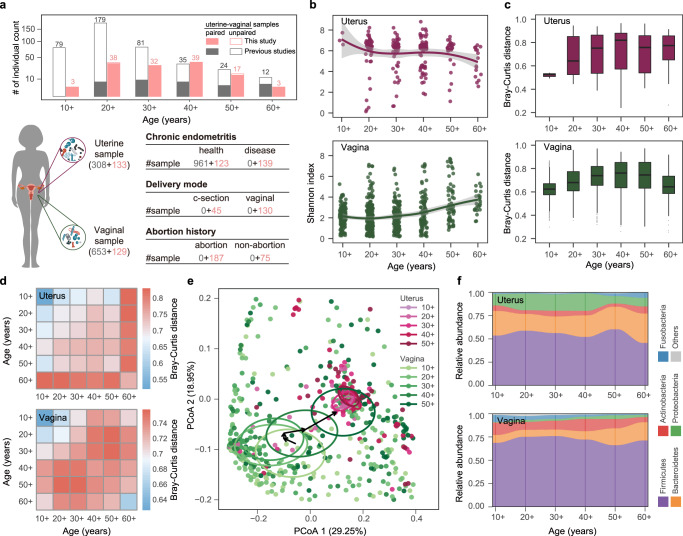
Fig. 1. Cohort overview and variations in uterine and vaginal microbiome associated with aging.
a The age distribution of women and the number of samples in different groups in this study. Gray bars, red bars, hollow bars, and solid bars represent women from previous studies, from this study, with single uterine or vaginal sample types, and with paired uterine-vaginal sample types, respectively. The number of samples in each age group is given on the bar. The number of sequenced samples from the uterus and vagina and information on chronic endometritis, delivery mode, and abortion history are shown in brackets and tables. Red and gray numbers indicate the samples collected in this study and in previous studies, respectively. b Microbial diversities of the uterine and vaginal microbiome in women of different ages. The scales 10+, 20+, 30+, 40 +, 50+, and 60+ on the x-axis represent ages <20, 20–29, 30–39, 40–49, 50–59, and ≥60 years, respectively. The shadow around the linear regression trendline shows the 95% confidence interval (CI). c The Bray-Curtis (BC) distance of the microbial communities among individuals of the same age group. Box-plot elements are defined as: center line, median; box limits, upper and lower quartiles; whiskers, 1.5× interquartile range; points, outliers. d The BC distance of the microbial communities among individuals within the same age group and between different age groups. e Principal coordinate analysis (PCoA) of the uterine and vaginal microbiome at each age stage. Each circle shows a 10% CI of each age group, and the arrow connects the vertical center of each circle. f The bacterial abundance of the uterine and vaginal microbiome at the phylum level, with different colors correspond to different phyla.

