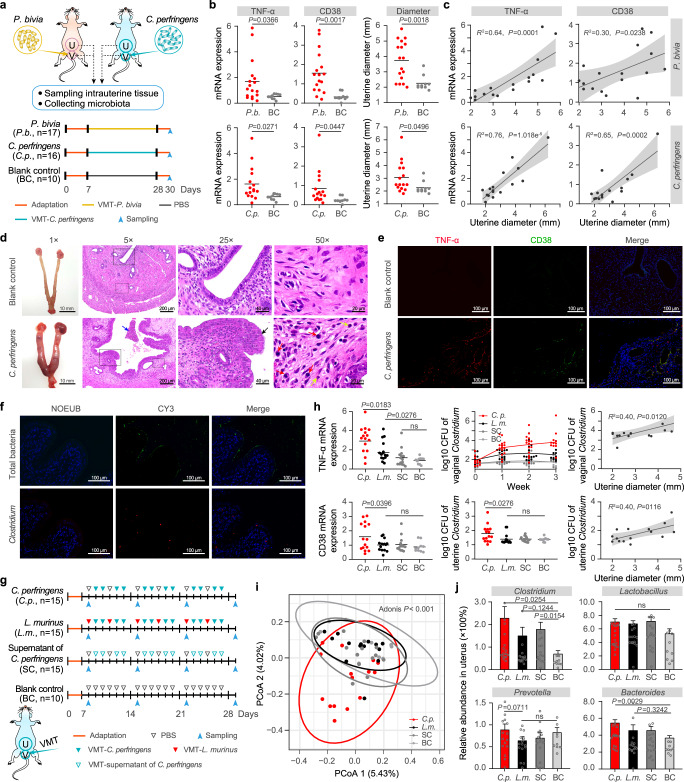
Fig. 5. Destructive and protective effects exerted by vaginal bacteria on the endometrium.
a Study design of the vaginal microbiota transplantation (VMT) challenge experiment involving injection of Prevotella bivia (P. bivia, P.b.) or Clostridium perfringens (C. perfringens, C.p.) into the vagina of SD rats. The rats in the blank control (BC) group were injected with PBS instead of bacteria. b The mRNA expression of inflammatory factors in the endometrial tissue and the diameter of the uterine body in the P.b. (n = 17), C.p. (n = 16) and BC (n = 10) rats. P values were determined by two-tailed Student’s t-test, and the lines among points show the means. c The correlation between mRNA expression of inflammatory factors and uterine diameter. The shadow around the linear regression trendline shows the 95% confidence interval (CI). d The uterine bodies and hematoxylin-eosin staining of the endometrial tissues in the C.p. and BC rats. The 25× and 50× fields of view show the areas within the solid and dashed frames of the 5× field of view. The blue arrow under a 5× field of view shows bleeding with blood cells and inflammatory cells (including lymphocyte cells and inflammatory granulocytes) in the uterine cavity. The black arrows under a 25× field of view show hyperplastic endometrial epithelium. The red and yellow arrows under a 50× field of view refer to plasma cells and inflammatory granulocytes, respectively. e Immunofluorescence assay illustrating the TNF-α and CD38 signals in the endometrial tissue of the C.p. and BC rats. f Fluorescence in situ hybridization (FISH) of total bacteria (green) and Clostridium (red) in the uterine cavity of the C.p. rats. g Study design of injecting C.p., Lactobacillus murinus (L. murinus, L.m.), supernatant of C. perfringens (SC) and PBS (BC) into the vagina of SD rats. h The mRNA expression of inflammatory factors in endometrial tissue, the biomass of vaginal and uterine Clostridium and their correlations with uterine diameter in VMT rats. i Principal coordinate analysis (PCoA) of the uterine microbiome of the C.p., L.m., SC, and BC rat groups. j Relative abundance of Clostridium, Lactobacillus, Prevotella, and Bacteroides in the uterine microbiota of the C.p. (n = 15), L.m. (n = 15), SC (n = 15) and BC (n = 10) rat groups. Data are presented as means ± s.e.m. For d–f images are representative of three independent experiments with similar results. For c, h linear regression was used to analysis the correlation between two pairs of data, the shadow around the trendline shows the 95% confidence interval (CI). For h, j P values were determined by one-way ANOVA with Tukey’s multiple comparison post-hoc test, and data are presented as means ± s.e.m, and ns represents P < 0.05.

