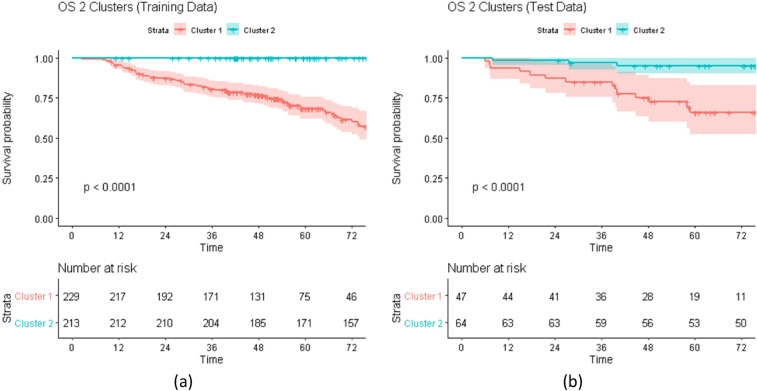
Figure 2.
Kaplan–Meier (KM) Curves for Overall Survival (OS). The figure shows the KM curves for OS outcome stratified by the cluster label over (a) training and (b) test data. For the training, the patients were grouped using Hierarchical Clustering over the co-occurrence matrix from the Random Survival Forest. For the testing, the patients were assigned to a cluster by applying the regression model trained for predicting the cluster labels using the top radiomic features identified by the random survival forest. For both training and testing, the KM curves are significantly different which indicates that the proposed clustering is effective in identifying a risk stratification and can be effectively used as a predictive covariate.

