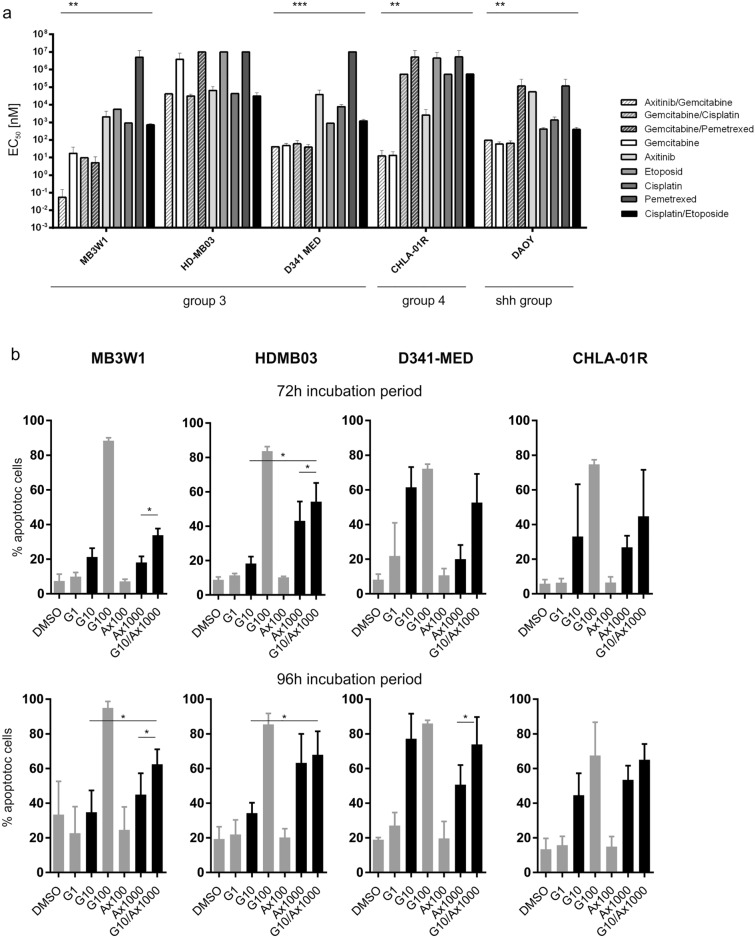
Figure 3.
(a) EC50-values of group 3, group 4 and SHH tumor cell lines treated with different cytostatic drugs (Mean ± SD; representative data from five independent experiments) Gemcitabine/axitinib vs. vehicle: MB3W1: **, p = .0079, D341MED: ***, p = .0009, CHLA-01R: **, p = .0079, DAOY: **, p = .005. All experiments involving ‘etoposide’ were done using its phosphate. (b) Medulloblastoma cell lines grown in FCS-free conditions and tested for apoptosis 72 h and 96 h respectively using ApotrackerGreen. Cells were exposed to the respective drugs with G1 meaning Gemcitabine 1 nM, other labelling accordingly. Black bars indicate the relevant dosages for mono- and combination therapy. Only this monotherapy was compared to combination therapy (paired t-test; only significant results are shown with *p < .05).Grey bars indicate additional concentrations tested in monotherapy only.

