Figure 5.
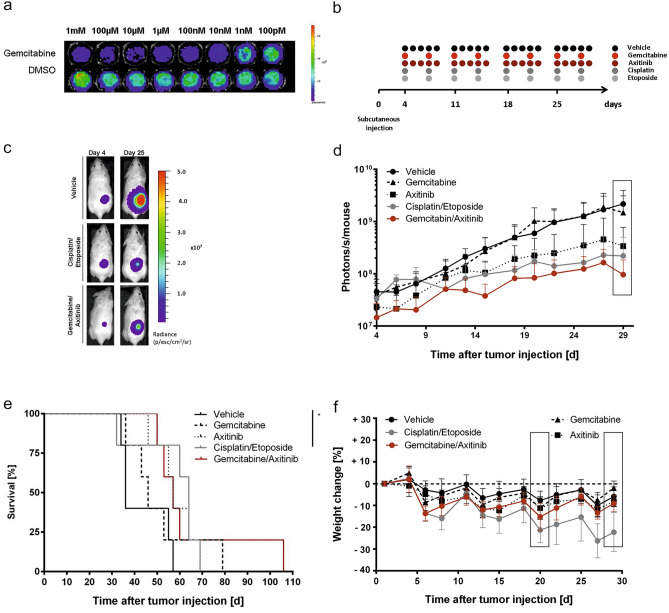
Axitinib and gemcitabine treatment in a subcutaneous xenograft tumor model. (a) Representative in vitro bioluminescence signal of MB3W1 after 48 h treatment with gemcitabine or vehicle control. (b) Experimental strategy: Injection of 1 × 106 MB3W1 in the right flank of NOD/SCID mice on day 0. On day 4 treatment of mice with cytostatic drugs started once weekly (gemcitabine, cisplatin, etoposide phosphate) and 5 times per week (axitinib), respectively, in 4 cycles. Tumor growth was monitored with non-invasive BLI. (c) Representative pictures of the BLI-Signal at the beginning (d4) and during therapy (d25). (d) Quantitative analysis of BLI-signals in different treatment groups (n = 5); data displayed as mean ± SD. Two-way ANOVA for multiple comparisons was perfromed on day + 29 (box) with the following p values: Cisplatin/Etoposide vs vehicle: ****; Gemcitabine/Axitinib vs vehicle: ****; Axitinib vs vehicle: ****; Gemcitabine vs vehicle: n.s.; Cisplatin/Etoposide vs Gemcitabine: **; Axitinib vs Gemcitabine: **; Gemcitabine/Axititinib vs Gemcitabine: ***. (e) Survival curves of treatment groups. Cisplatin/Etoposide vs Vehicle: *; all other comparisons: n.s. (f) Comparison of weight change as an indicator of toxicity. Two-way ANOVA for multiple comparisons was done on two specific time points (boxes) and a significant difference was indicated as follows: day + 20: Cisplatin/Etoposide vs Vehicle: ****; Cisplatin/Etoposide vs Gemcitabine: **; Cisplatin/Etoposide vs Axitinib: **; all other comparisons: n.s.; day + 29: Vehicle vs Cisplatin/Etoposide: ****; Cisplatin/Etoposide vs Gemcitabine: ****; Cisplatin/Etoposide vs Axitinib: ****; Cisplatin/Etoposide vs Gemcitabine/Axitinib: ***; all other comparisons: n.s.

