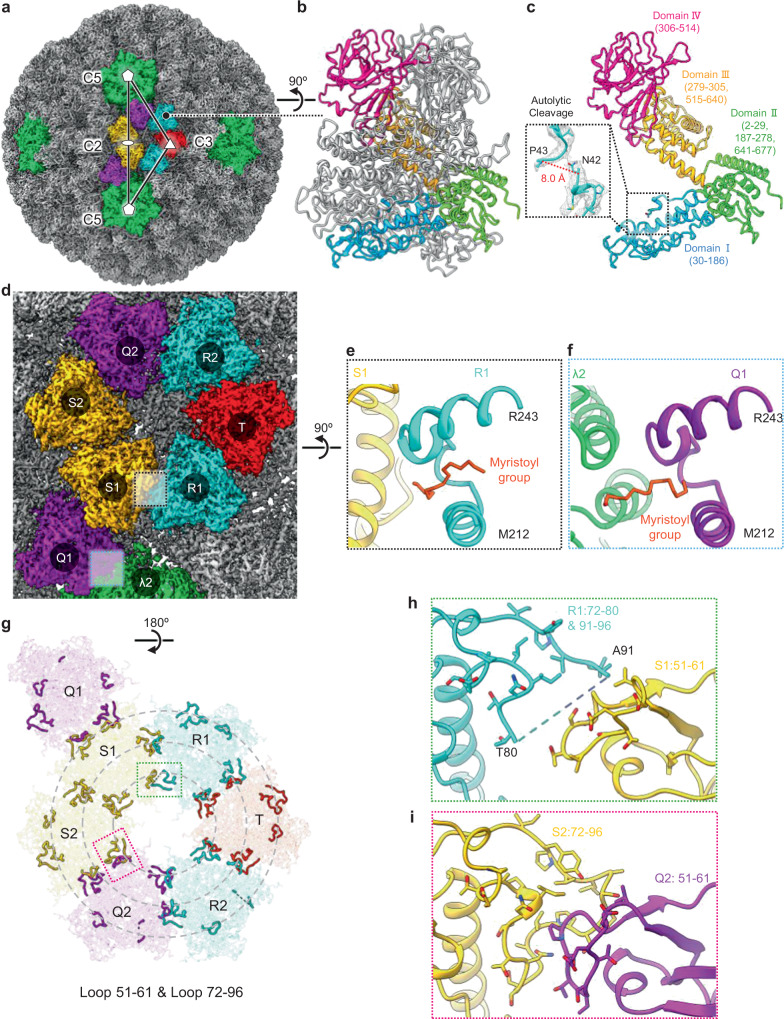
Fig. 6. Autolytically cleaved penetration protein μ1 with myristoyl groups and interaction loops.
a Density map view of ISVP facing the 2-fold axis. λ2 is colored in green, while μ1.Q, S, R, and T trimers are colored in purple, yellow, blue, and red, respectively. White pentagons, triangle, and oval represent the icosahedral 5-fold, 3-fold, and 2-fold symmetry axes, respectively. Black triangle, connecting white symmetry points, represents an asymmetric unit. b Ribbon representation of μ1 trimer, with one μ1 monomer colored by domain (domain I, blue; domain II, green; domain III, yellow; domain IV, magenta). c Ribbon representation of isolated μ1 monomer, showing autolytic cleavage between residues 42 and 43 in the boxed region. d Zoom-in surface representation of μ1 hexagon from (a), formed by μ1 S1, S2, Q2, R2, T, and R1 trimers. e Zoom-in view of R1’s myristoyl group (stick representation) and hydrophobic pocket (ribbon representation), as well as neighboring S1 (ribbon representation) from black box in (d). f Zoom-in view of Q1’s myristoyl group (stick representation) and hydrophobic pocket (ribbon representation), as well as neighboring λ2 (ribbon representation) from blue box in (d). g Flipped view of (d), in ribbon representation, highlighting loops 51–61 and 72–96, which are divided by three concentric dashed circles. h Zoom-in ribbon representation of R1’s loop 72–96 (81–90 unmodeled) and S1’s loop 51–61, from green box in (g). i Zoom-in ribbon representation of S2’s loop 72–96 and Q2’s loop 51–61, from magenta box in (g).

