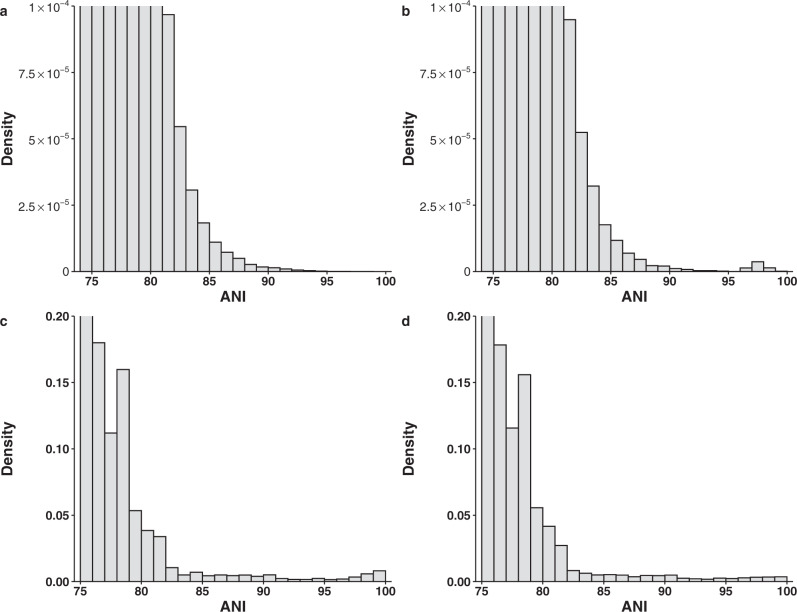
Fig. 1. Distribution of ANI values.
Top panel: from the phylogenetic simulations. a Comparisons between 3000 taxa simulated using a phylogenetic tree with 3000 tips and a constant rate of diversification. b Comparisons in the same dataset except that 30 of 3000 taxa each have two very closely related genomes sequenced. Bottom panel: from genomes subsampled from the 90K genome dataset. c Two genomes were randomly selected from each of the 397 named species with ≥10 genomes. d Two phylogenetic representative genomes were selected for each of the 397 named species with ≥10 genomes.

