
Figure 1.
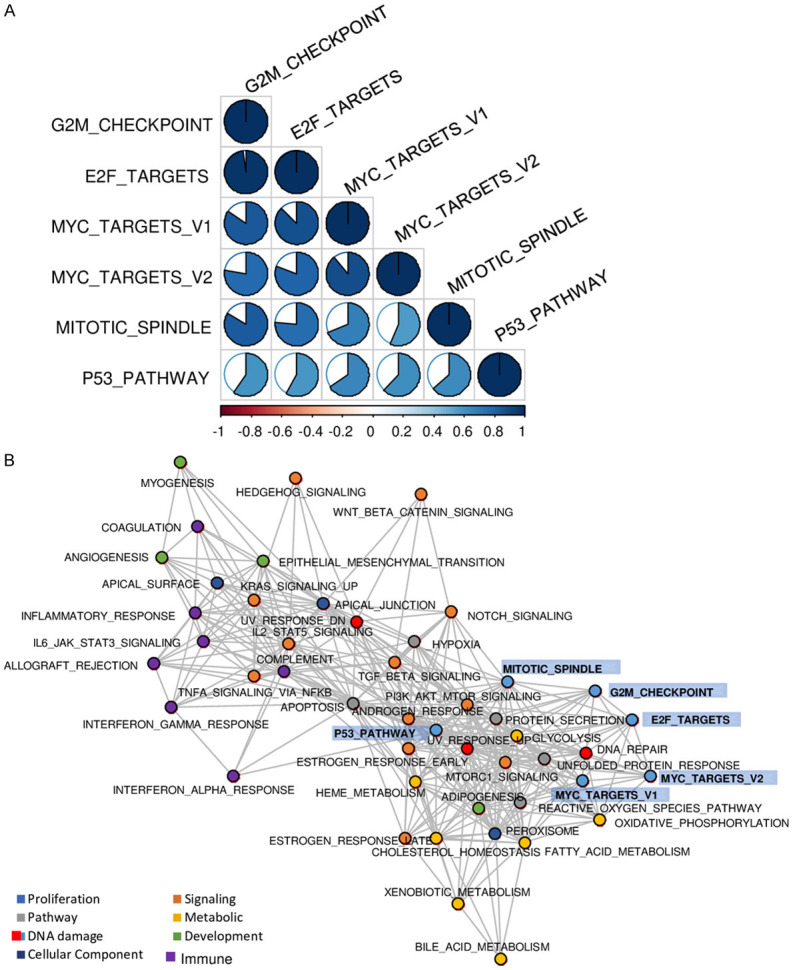
Characteristics of six cell proliferation-related pathway scores in the TCGA pancreatic adenocarcinoma cohort. A. Correlation matrix of six cell proliferation-related pathway scores. The correlation value was indicated by color (blue for positive correlation and red for negative correlation), while the magnitude of correlation was shown with circles. Spearman’s rank correlation was used to the analysis. B. Network plot for highly correlations of hallmark gene sets. Spearman’s rank correlation > 0.600 was defined as highly significantly correlated gene sets.