
Figure 3.
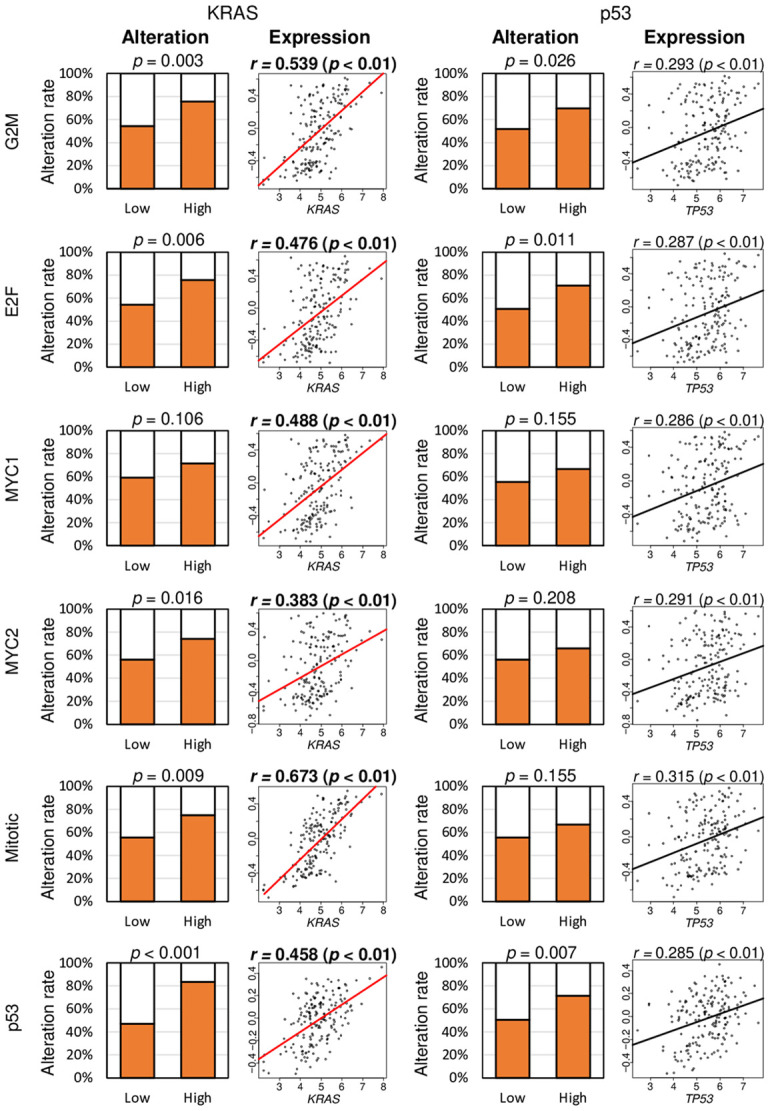
The association of six cell proliferation-related pathway scores with alteration and expression of KRAS and TP53 genes in the TCGA cohort. Bar plots of the percentage of patients with alteration of KRAS and TP53 genes between low and high gene sets. The median value was used to divide low and high score groups as a cut-off. The Fisher’s test was used for the analysis. Correlation plots of cell proliferation-related pathway scores with gene expression of KRAS and TP53. Spearman’s rank correlation was used for the analysis. G2M, G2M Checkpoint; E2F, E2F Targets; MYC1, MYC Targets V1; MYC2, MYC Targets V2; Mitotic, Mitotic Spindle; p53, p53 pathway.