Figure 4.
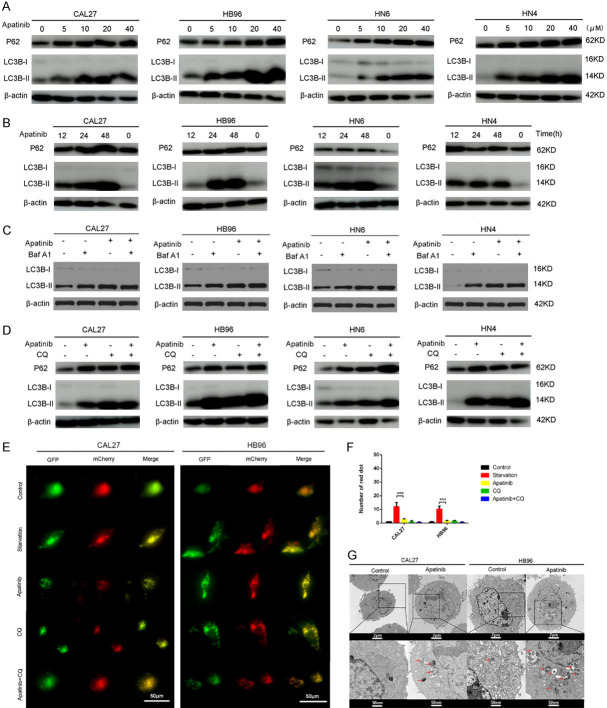
Apatinib inhibits autophagy in OSCC cells. A: OSCC cells were incubated in medium containing 5, 10, 20 and 40 μM apatinib for 24 h, and the expression of P62 and LC3-II was measured by western blot. B: OSCC cells were incubated in medium containing 20 μM apatinib for 12, 24 and 48 h, and the expression of P62 and LC3-II was measured by western blot. C: OSCC cells were incubated in medium containing 20 μM apatinib for 24 h with or without Baf A1 (50 nM), and the expression of LC3-II was measured by western blot. D: OSCC cells were incubated in medium containing 20 μM apatinib for 24 h with or without CQ (50 nM), and the expression of P62 and LC3-II was measured by western blot. β-Actin was used as the control. E, F: Representative images of early autophagosomes (yellow dots generated from overlapping GFP and mCherry puncta), shown as yellow points, and late autolysosomes (red dots generated from RFP puncta), shown as red points. CAL27-GFP-mcherry-LC3 and HB96-GFP-mcherry-LC3 cells (transfected with the GFP-mcherry-LC3 lentivirus) treated with 20 μM apatinib for 24 h, starvation, or 50 nM CQ for 12 h. ***P<0.001. G: Autophagic vacuoles (red arrows) were seen in CAL27 and HB96 cells incubated in apatinib (20 μM) for 48 h. Few autophagic vacuoles were seen in the control group. These experiments were repeated three times.

