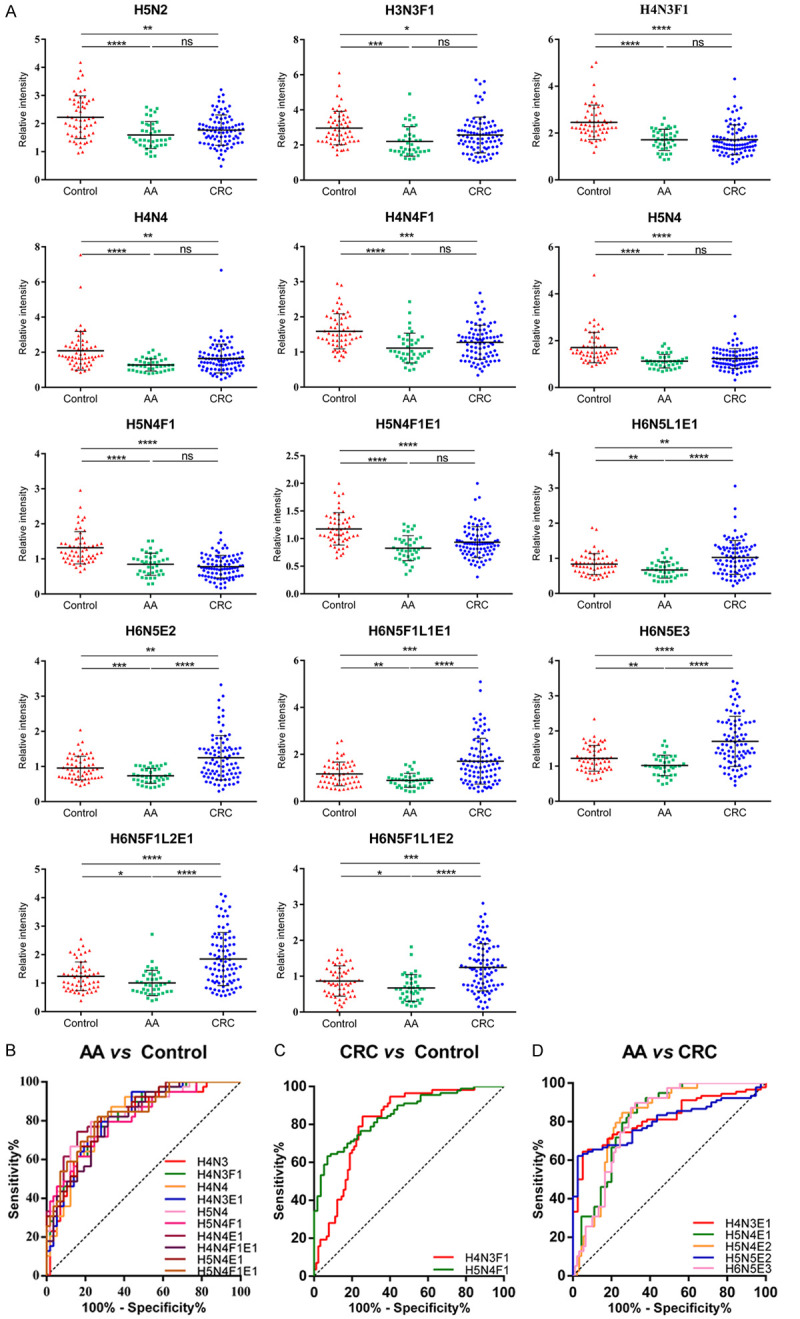
Figure 4.

Relative intensity of the N-glycans with significant differences and their ROC analysis. (A) Scatter plot depicting the different relative intensity of fourteen N-glycans structure in AA and CRC compared with healthy controls. (B-D) Receiver operating characteristic (ROC) curve analyses for the the N-glycans with AUC above 0.8 of AA vs Control (B), CRC vs Control (C) and AA vs CRC (D). H = hexose, N = N-acetylhexosamine, F = fucose, L = lactonized N-acetylneuraminic acid (α2,3-linked), E = ethyl esterified N-acetylneuraminic acid (α2,6-linked). * The equivalent of P<0.05, ** the equivalent of P<0.01, *** the equivalent of P<0.001, **** the equivalent of P<0.0001.
