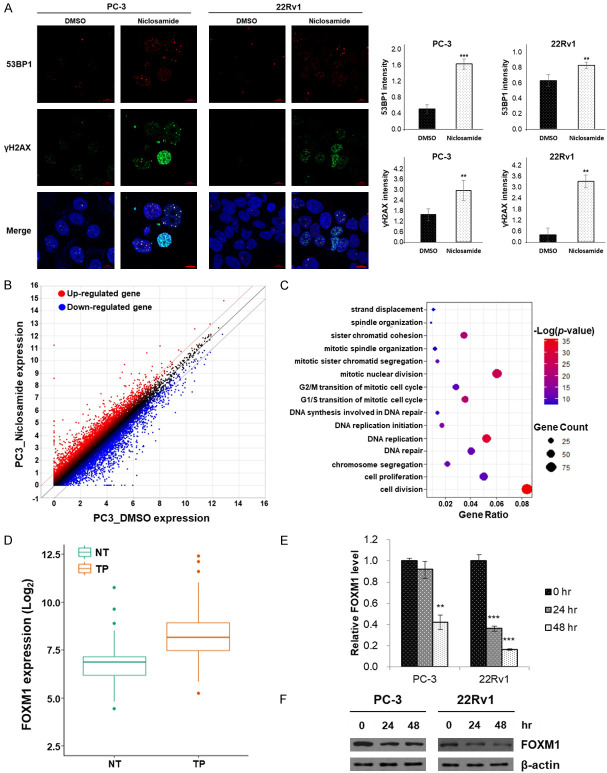
Figure 2.
Niclosamide induces DNA damage response in CRPC cells. (A) Nuclear γH2AX and 53BP1 foci were detected using immunofluorescence staining (γH2AX, green; 53BP1, red) and nuclei were counterstained with DAPI (blue). Scale bar, 10 µm. The fluorescence intensity of each group was analyzed using the ZEN 2012 Black Edition software. (B) Scatter plot of all expressed genes in PC-3 cells incubated with DMSO or niclosamide. Red dots indicated the up-regulated genes while blue dots indicated the down-regulated genes. The screening threshold is defined as a fold change > 2.0 and P < 0.05. (C) Dot plot of the significantly screened GO term of biological processes using DAVID. (D) Analysis of FOXM1 mRNA expression in tumor and adjacent normal tissues using the TCGA data set. (E) PC-3 and 22Rv1 cells were incubated with 2.5 μM niclosamide for 24 or 48 hr. FOXM1 mRNA expression was quantified using qRT-PCR. β-actin mRNA was used as an internal control to normalize the data. (F) Cell lysates were prepared after the same treatment as in (E). FOXM1 protein was detected by western blot analyses and β-actin was used as an internal control. Data in (A) and (E) are presented as the mean ± SD of two experiments performed in triplicate. **P < 0.01, ***P < 0.001, two-tailed Student’s t test or one-way ANOVA test.

