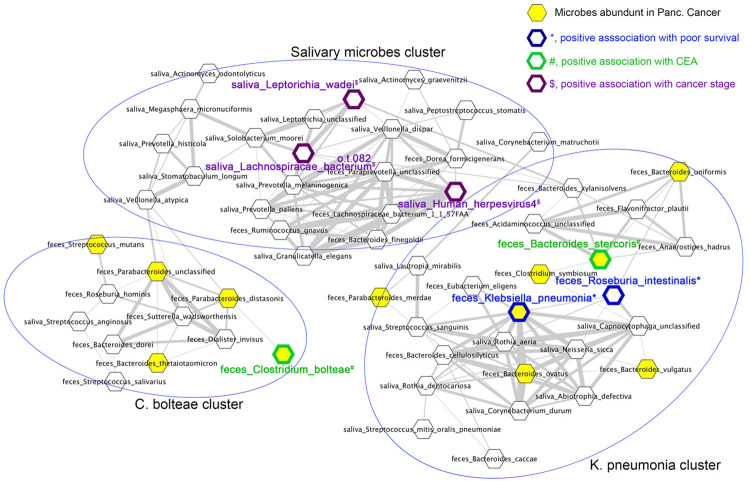
Figure 2.
Gut microbiota compositions of pancreatic cancer patients are highly associated with the oral microbiota and prognostic factors. Pearson correlation was calculated between relative abundances of fecal and salivary microbes in PC patients and is shown as networks. Correlations coefficients ≥0.7 are shown as edges. Nodes of fecal microbes abundant in PC patients compared with HDs are highlighted in yellow. *, positive association with a poor prognosis based on the increased hazard of death, blue border; #, positive association with serum CEA level, green border; $, positive association with cancer stage, purple border. This figure is part of Supplementary Figure 2.

