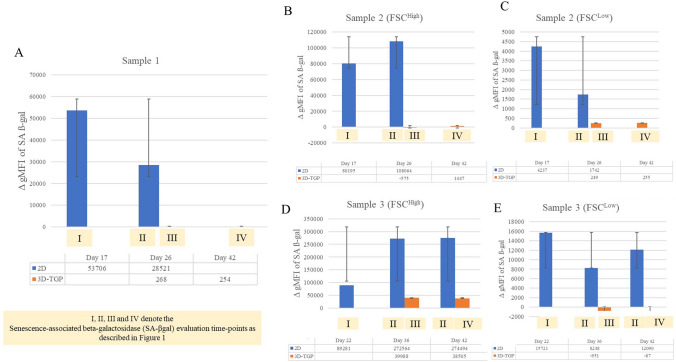
Figure 4.
Mean fluorescence intensity (ΔG MFI) of the expression of SA-βgal evaluated by flow cytometry in 2D compared to 3D-TGP at different durations of culture with 2D-cultured chondrocytes (evaluation I and II) showing higher levels of SA-βgal as culture, while the 3D-cultured cells (evaluation III and IV) showed very low levels of SA-βgal throughout the culture period. (A) Sample 1; (B) Sample 2 (FSC(High)); (C) Sample 2 (FSC(Low)); (D) Sample 3 (FSC(High)); (E) Sample 3 (FSC(Low)). I, II, III and IV denote the Senescence-associated beta-galactosidase (SA-βgal) evaluation time-points as described in Fig. 1.

