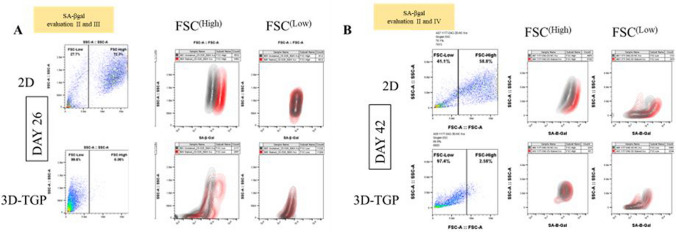
Figure 5.
Gating in the flow cytometric analysis of osteoarthritic chondrocytes grown in 2D and 3D-TGP with the SA-βgal expression in two heterogeneous populations sorted by flow cytometry (FSChigh versus FSClow) with the 2D-grown cells showing higher SA-βgal expression than 3D-TGP cultured cells on both day 26 and day 42 of culture (A) Day 26; (B) Day 42. II, III and IV denote the Senescence-associated beta-galactosidase (SA-βgal) evaluation time-points as described in Fig. 1.

