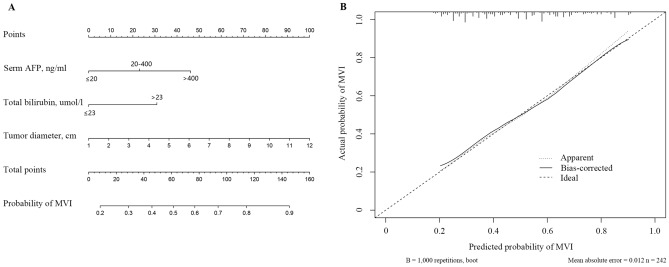
Figure 3.
Developed diagnosis nomogram for microvascular invasion prediction. (A) A vertical line was drown upward to find the number of points received for AFP, tumor diameter and TB. The sum of three influencing factors was presented on the total point axis, and a vertical line was also drawn downward to the the probability of MVI. (B) The calibration curves of nomogram model prediction in HCC patients. The X-axis showed the predicted probability of MVI. The Y-axis showed the actual probability of MVI. The solid line indicated the performance of the developed nomogram model.

