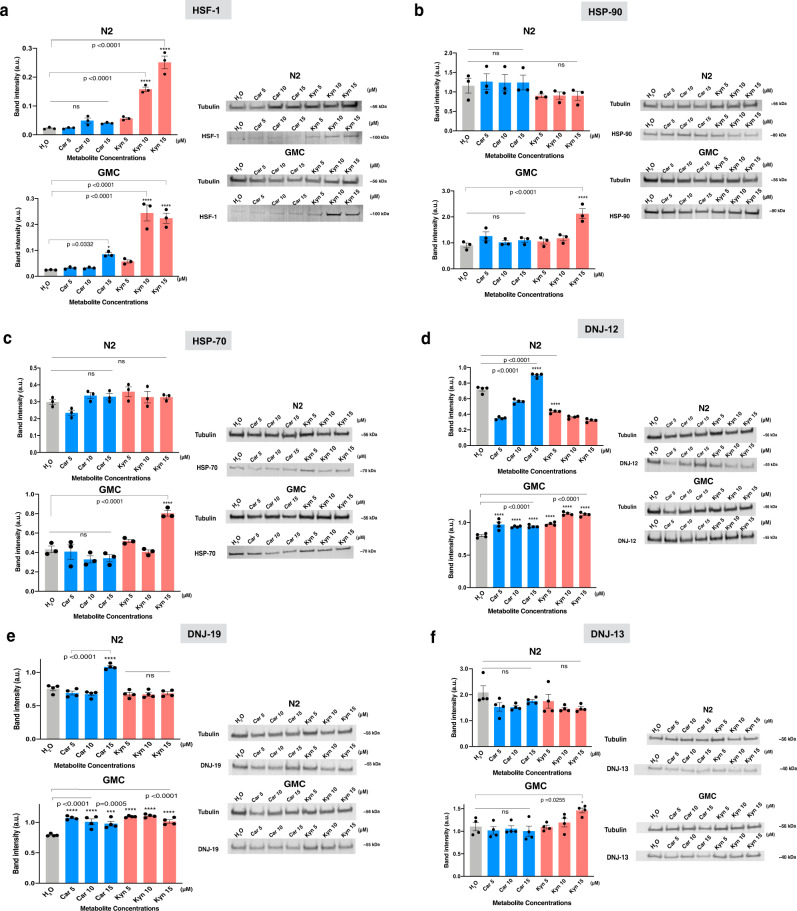
Fig. 5. Carnosine and kynurenic acid activate a cytosolic unfolded protein response through an HSF-1-dependent mechanism.
Western blots show a differential increase in protein levels on treatment with the two metabolites (a–f). On treatment with carnosine and kynurenic acid, we observe a relative increase in the protein levels of molecular chaperones and their co-chaperones in worm lysates relative to the controls, untreated N2 and GMC. n = ∼3000 worms per condition; we measured 3–4 replicates per condition; only a representative western blot is shown for each condition. From the experiments described in Fig. 3, a significant increase in motility and a corresponding decrease in the NIAD-4-stained aggregates were observed at a dose of 15 μM of both the metabolites. All error bars depict standard error of mean (SEM). a–f show bands of HSF-1, downstream molecular chaperones, and J proteins namely HSP-90, HSP-70, DNJ-12, DNJ-19, and DNJ-13, respectively, for both N2 (wild type) and GMC (AD model) worms. For each Western blot experiment, we used Tubulin signal to normalize for total protein concentration in each lane. We then normalized each condition of the chaperone/co-chaperone band with its corresponding tubulin band from the same experiment run on a parallel gel, to plot the intensities in ImageJ. The gels for each condition were run, respectively, at the same time, using the same running buffer, in the same electrophoretic cell and the same western blot transfer sandwich onto membranes. These membranes were further developed using appropriate antibodies (see the “Methods“ section, Supplementary Fig. 5). Statistics are performed in GraphPad Prism using ordinary one-way ANOVA; we used Dunnett’s multiple comparisons test with untreated (H2O) for each N2 and GMC metabolite-treated groups; p-values are indicated in the figure sub-panels.

