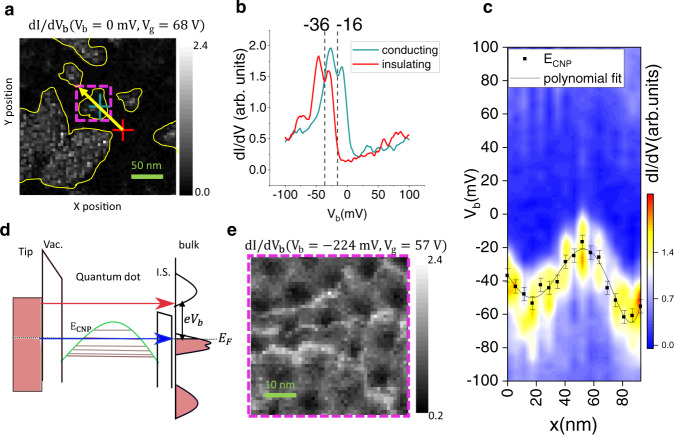
Fig. 3. Evidence of local doping variation in the sample.
a Shows a spatial map of a 246 × 246 nm2 region (scale bar 50 nm). Several bright regions, indicating a high density of states, which are surrounded by dark regions, indicating a low density of states are visible. The thin yellow lines are a guide for the eyes. b Shows individual spectra measured at the positions marked by the red and green crosses in a. A lateral shift of the two spectra with respect to the indicates a difference in the local chemical potential. The approximate location of the charge neutrality point taken as the dip between the two VHS is also labeled. c is a line-cut across the conducting island in a in a direction indicated by the yellow arrow. The variation of the local charge neutrality point energy () as a function of position can be seen which indicates local doping variation. The black line is a 5th order polynomial fit. Error bars represent uncertainty in the determination of CNP due to finite energy resolution. The bright conducting regions surrounded by the darker insulating regions act like quantum dots. d A tunneling diagram of the system. There are two tunneling barriers: the large vacuum barrier between the tip and the dot and the shorter barrier between the dot and the bulk of the sample. The quantum dot is defined by a potential well which has the shape indicated by the local charge neutrality point. Confined states within this potential well are indicated by horizontal lines. There are low-energy electron tunneling events from the tip into the confined states of the quantum dot and then into the bulk of the sample (blue arrow). There also exist direct tunneling from the tip to the higher energy bands of the bulk of the sample (red arrow). e Shows a high resolution spatial map of the conducting island indicated by the magenta square in a. The three bright wavefronts are three single electron charging states confined in the bright island. The shape of the bright wavefronts approximately matches the shape of the bright island.

